Receipt Dashboard
Introduction/Purpose
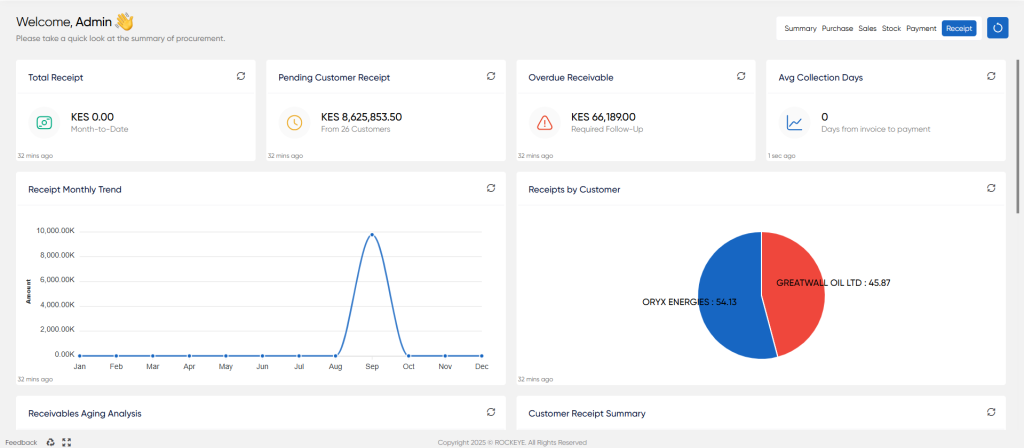
The Receipt Dashboard is the central command center for managing all incoming funds from your customers for the sale of white products (oil). It provides a comprehensive, real-time view of your accounts receivable, cash flow, and customer payment behavior.
This dashboard is an essential tool for finance teams, credit controllers, and sales managers to monitor cash inflows, track outstanding invoices, identify overdue payments, and ensure the financial health of the sales cycle.
Total Receipts
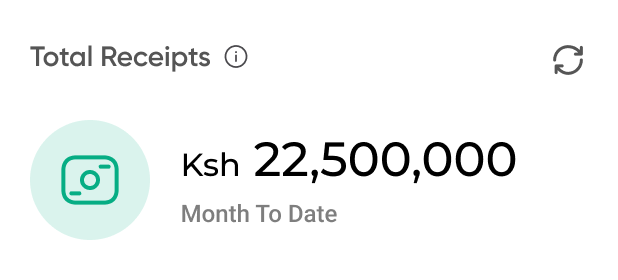
Total Receipts: Displays the total monetary value received from customers within the current month-to-date.
Pending Customer Receipts
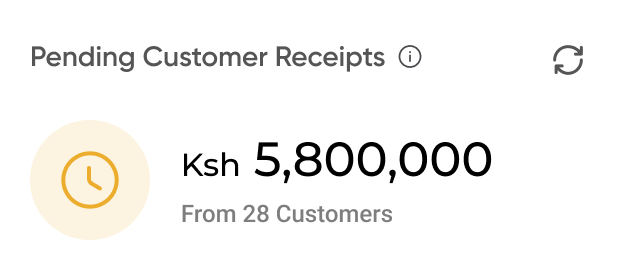
Pending Customer Receipts: Shows the total value of invoices that have been issued but are not yet past their due date. It also indicates the number of customers this amount is spread across.
Overdue Receivables
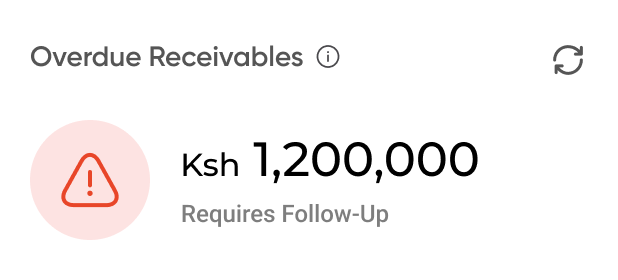
Overdue Receivables: An urgent alert that highlights the total value of customer payments that are past their due date and require immediate follow-up.
Avg Collection Days
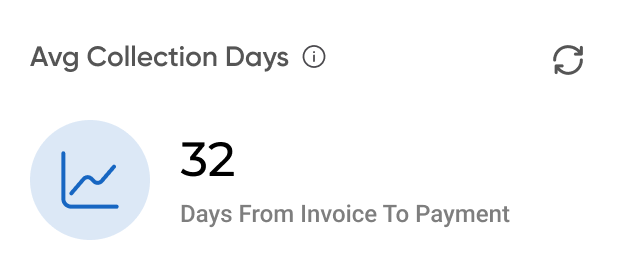
Avg Collection Days: This metric, also known as Days Sales Outstanding (DSO), calculates the average number of days it takes to collect payment from customers after an invoice has been issued. A lower number indicates greater efficiency.
Receipt Trend (Monthly)
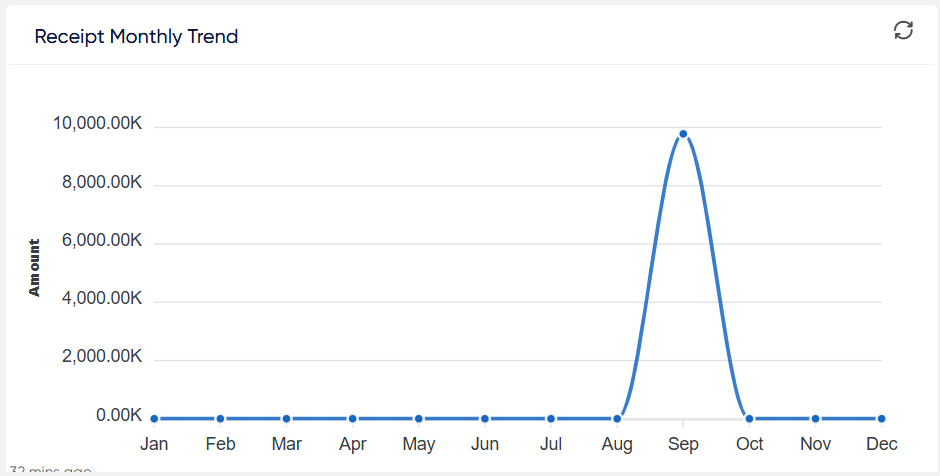
This line graph visualizes the total value of receipts collected each month over a period of time. It helps you identify trends in your cash flow, recognize seasonal patterns in customer payments, and track the overall effectiveness of your collection efforts.
Receipts by Customer
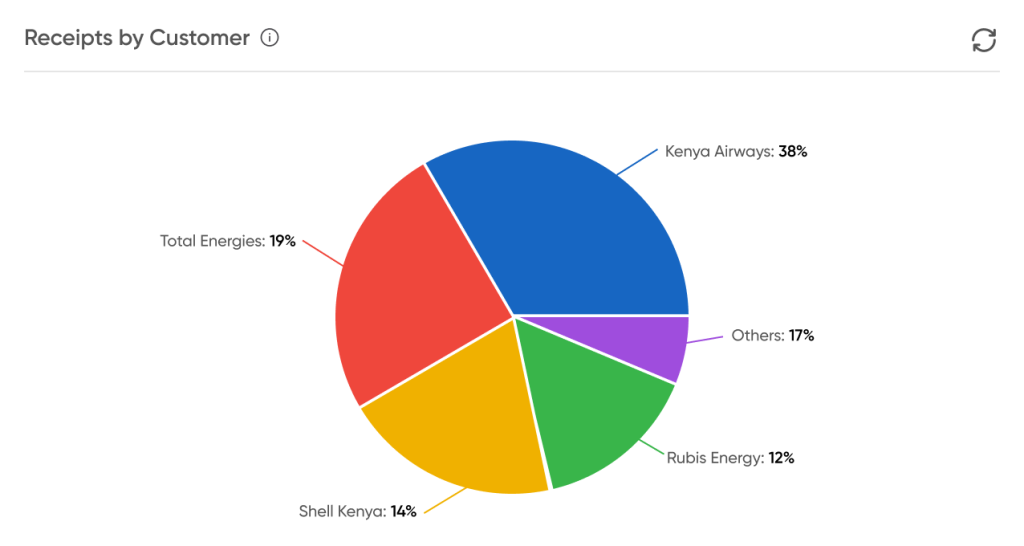
This widget provides a clear breakdown of your cash inflows by customer, using a pie chart and a corresponding summary list.
- Pie Chart: Visually represents the contribution of each key customer to your total receipts, showing their share as a percentage.
- Summary List: Complements the chart by providing the exact monetary value received from each of your top customers. This helps you quickly identify your most significant sources of revenue.
Receivables Aging Analysis
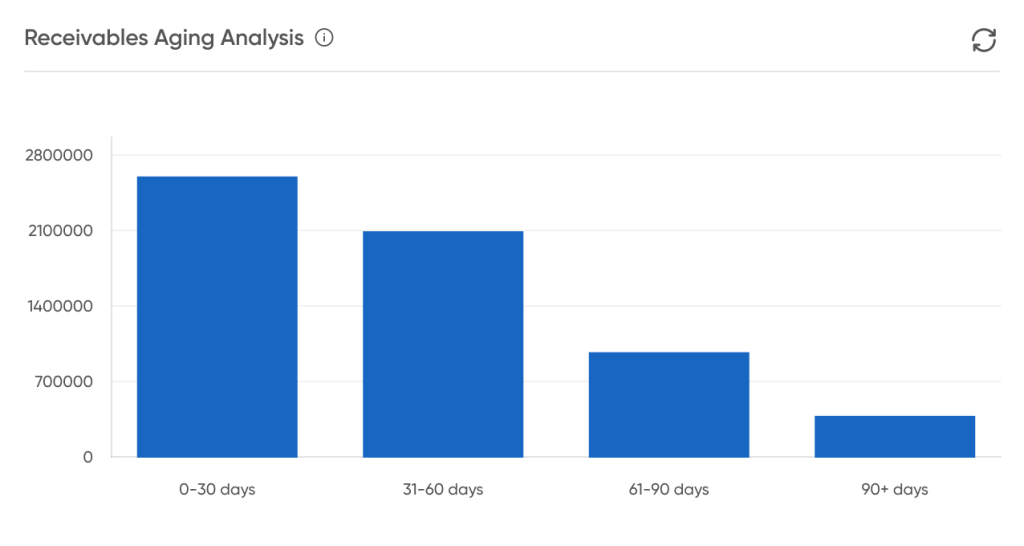
This bar chart is a standard accounts receivable aging report. It categorizes all unpaid customer invoices into time-based buckets according to their due dates:
- 0-30 days
- 31-60 days
- 61-90 days
- 90+ days
This analysis is critical for managing credit risk, prioritizing collection efforts, and forecasting potential cash flow challenges.
Customer Receipt Summary
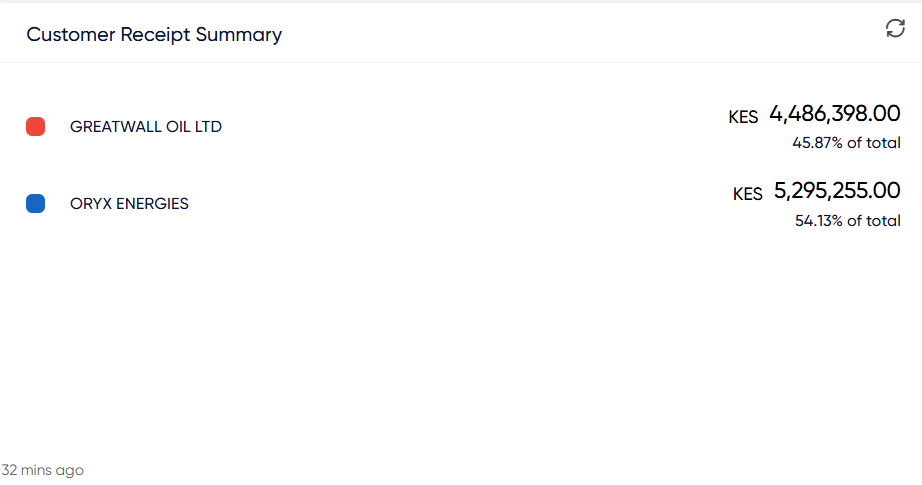
Customer Receipt Summary provides a financial breakdown of the total amount of money received from customers over a defined period. This report is a vital tool for tracking cash inflow and analyzing the revenue contribution from major clients.
Recent Receipt Transactions
This table provides a real-time log of recent incoming payment transactions and the status of related invoices. It includes a + Record Receipt button for efficient data entry.
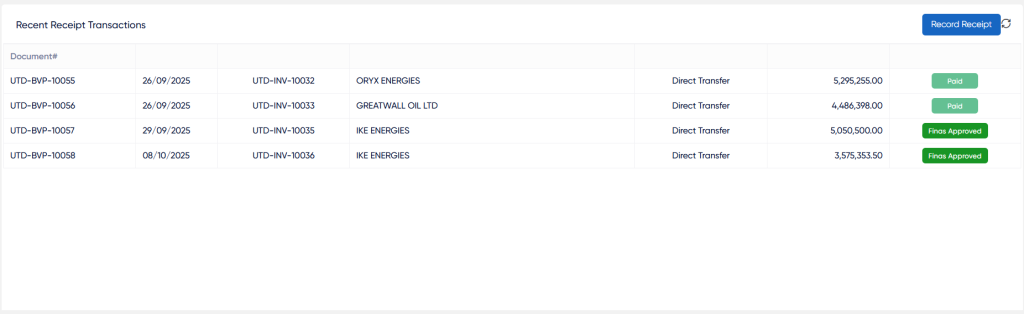
- Receipt# The unique system-generated ID for the receipt transaction.
- Due Date The date the corresponding invoice was due for payment.
- Receipt Date The actual date the payment was received from the customer.
- Invoice# The reference number of the customer's invoice that was paid.
- Customer The name of the customer who made the payment.
- Method The method used for the payment (e.g., Bank Transfer, Cheque).
- Amount The total value of the receipt.
- Status The current status of the underlying invoice, clearly indicated by color: Paid (Green), Pending (Yellow), Overdue (Red).

