Payment Dashboard
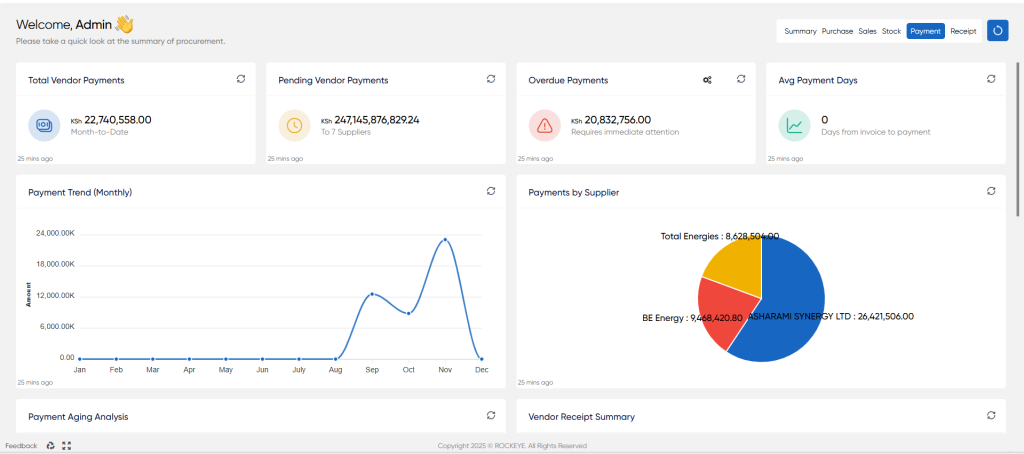
The Payment Dashboard provides a centralized and comprehensive view of all outgoing payments to your suppliers and vendors for white product (oil) purchases. It is a critical tool for the finance and procurement departments to manage accounts payable, monitor cash outflow, and maintain healthy supplier relationships.
This dashboard helps you track payment statuses, identify overdue invoices, analyze spending patterns, and manage your payment cycles efficiently, ensuring that your financial obligations are met in a timely manner.
Total Vendor Payments
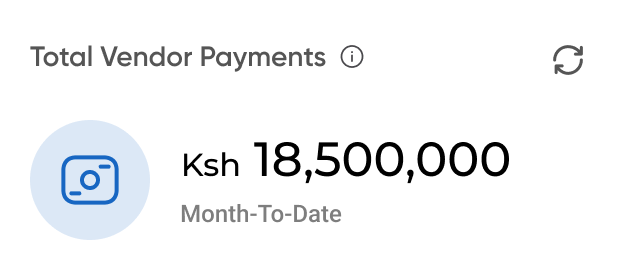
Total Vendor Payments: Shows the total monetary value that has been paid to all vendors within the current month-to-date.
Pending Vendor Payments
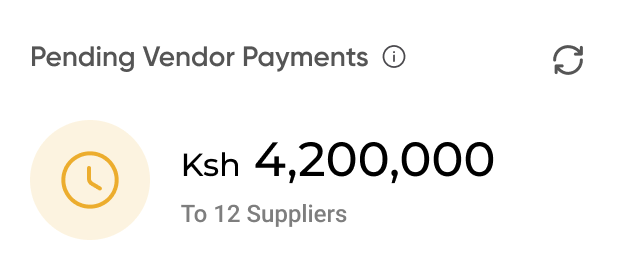
Pending Vendor Payments: Displays the total amount currently owed to suppliers that is not yet past its due date. It also indicates the number of suppliers this amount is distributed across.
Overdue Payments
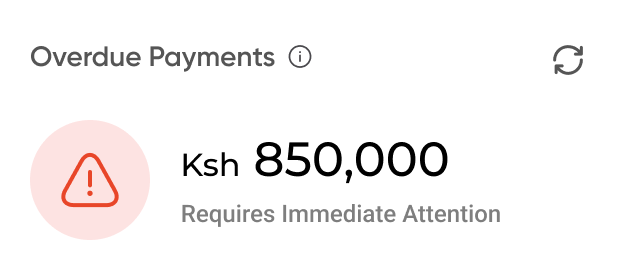
Overdue Payments: An alert that highlights the total value of payments that are past their due date and require immediate attention to avoid damaging supplier relationships or incurring penalties.
Avg Payment Days
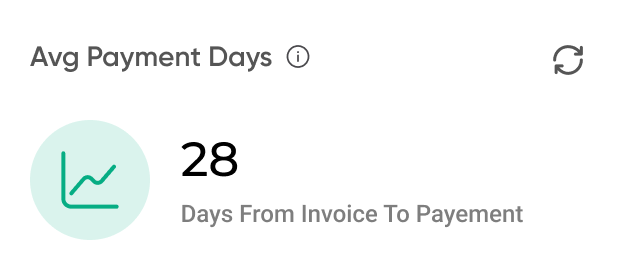
Avg Payment Days: This metric calculates the average number of days it takes for your company to pay a supplier from the date of the invoice. It is a key indicator of your payment process efficiency.
Payment Trend (Monthly)
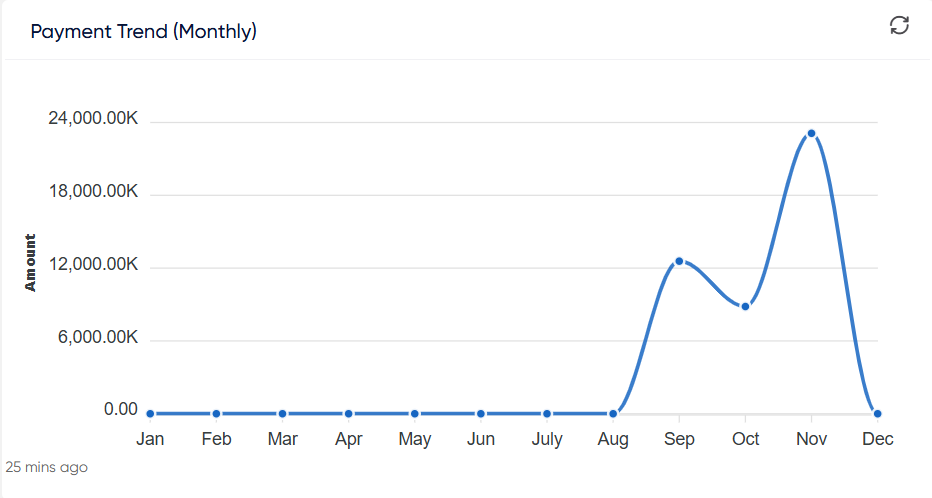
This line graph visualizes the total amount of payments made each month over a period of time. It is used to identify trends in cash outflow, seasonal spending patterns, or significant one-time expenditures.
Payments by Supplier
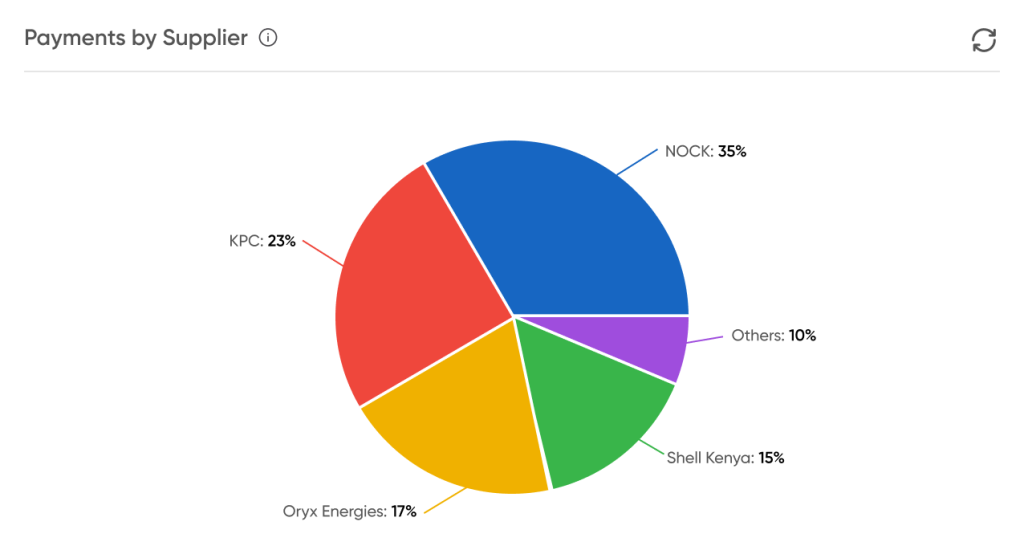
This widget consists of a pie chart and a corresponding summary list, providing a clear breakdown of where your money is going.
- Pie Chart: Visually represents the distribution of total payments among your top suppliers, showing each supplier's share as a percentage of the total.
- Summary List: Provides the exact payment value for each of the top suppliers, giving precise data to support the visual chart. This helps in identifying key vendors and understanding financial dependencies.
Payment Aging Analysis
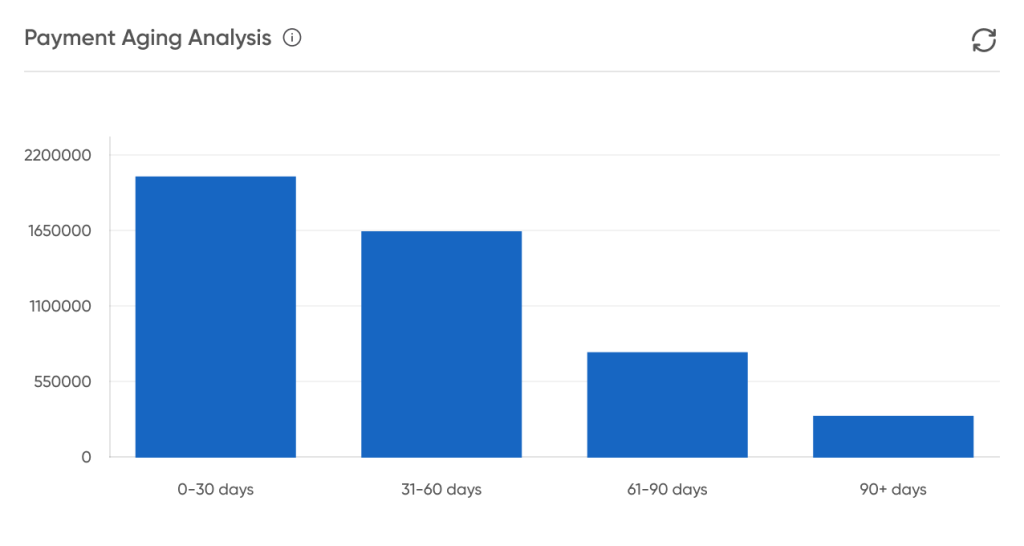
This bar chart is a classic accounts payable aging report. It categorizes all outstanding (unpaid) invoices into time-based buckets based on their due dates:
- 0-30 days
- 31-60 days
- 61-90 days
- 90+ days
This analysis is crucial for managing cash flow and prioritizing payments, especially for invoices that are becoming significantly overdue.
Vendor Receipt Summary
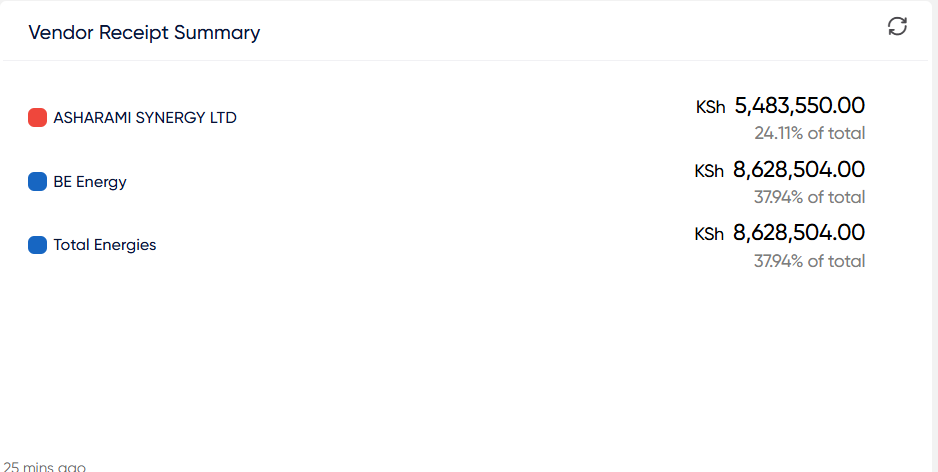
Vendor Receipt Summary,is used to provide a high-level overview of the total payments made by the company to its key suppliers (vendors) over a specified period.
It tracks the total financial outflow to major vendors, allowing management to quickly gauge the scale of expenditure and the proportion paid to each supplier.
Recent Payment Transactions
This table provides a real-time log of recent payment activities, offering a detailed view of individual transactions. It includes a + Record Payment button for quickly initiating new payment entries.
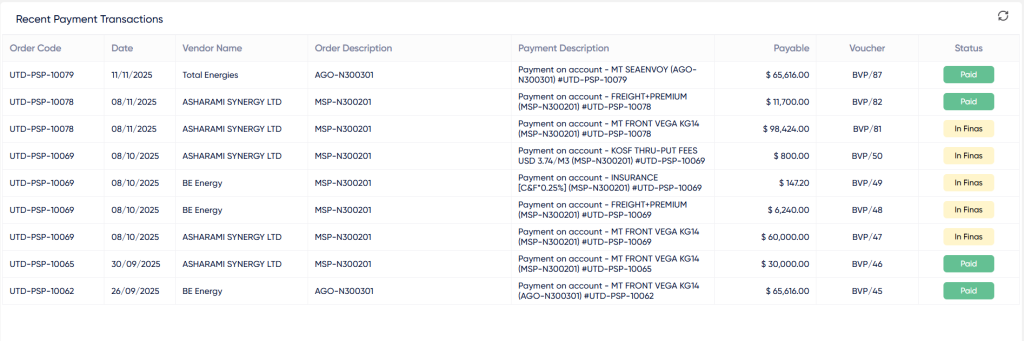
- Payment# The unique system-generated ID for the payment transaction.
- Due Date The date by which the corresponding invoice was due to be paid.
- Payment Date The actual date the payment was made or is scheduled to be made.
- Invoice# The reference number of the supplier's invoice being paid.
- Supplier The name of the vendor receiving the payment.
- Method The method used for the payment (e.g., Bank Transfer, Cheque).
- Amount The total value of the payment.
- Status The current state of the payment, clearly indicated by color: Paid (Green), Pending (Yellow), Overdue (Red).

