Stock Dashboard
Introduction/Purpose
The Stock Dashboard is your command center for inventory management. It provides a comprehensive, real-time overview of your white product (oil) stock levels, movements, and statuses across all locations.
This dashboard is designed for inventory managers, logistics coordinators, and operations teams to monitor inventory health, anticipate shortages or overstocks, track key compliance documents (manifests), and analyze the flow of goods. It turns complex inventory data into actionable insights, helping you optimize stock levels and ensure product availability.
Total Stock (MT)
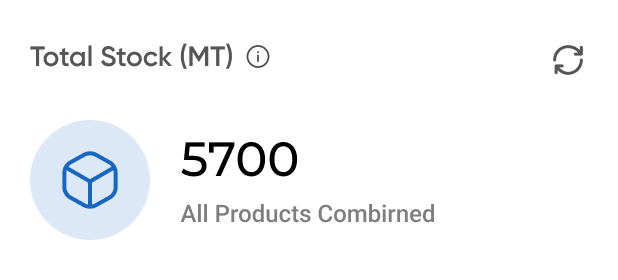
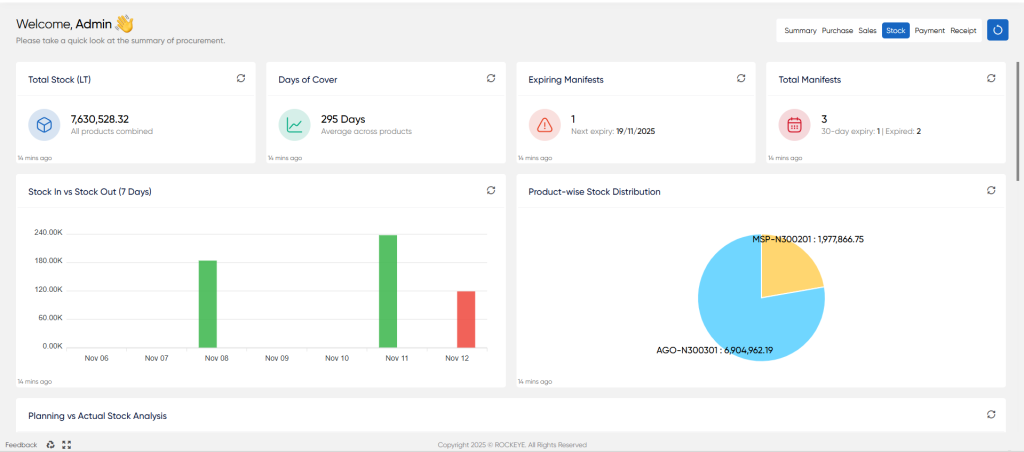
Total Stock (MT): Displays the current combined inventory level of all products, measured in Metric Tons.
Days Of Cover

Days of Cover: Calculates the average number of days your current inventory will last based on recent sales velocity. This metric is critical for forecasting and preventing stockouts.
Expiring Manifests
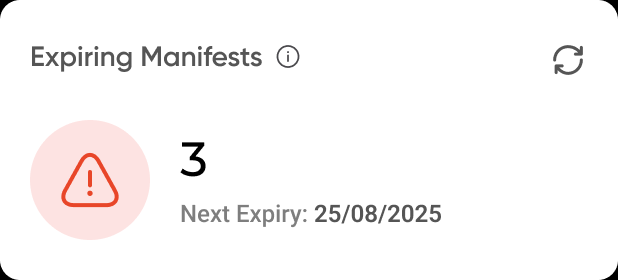
Expiring Manifests: An urgent alert that shows the number of manifests nearing their expiration date. It highlights the date of the next expiry, prompting immediate action to avoid compliance issues or delays.
Total Manifests

Total Manifests: Provides a summary of all manifests, including a count of those expiring within the next 30 days and those that have already expired.
Stock In vs Stock Out (7 Days)
This bar chart visualizes the daily flow of inventory over the last seven days.
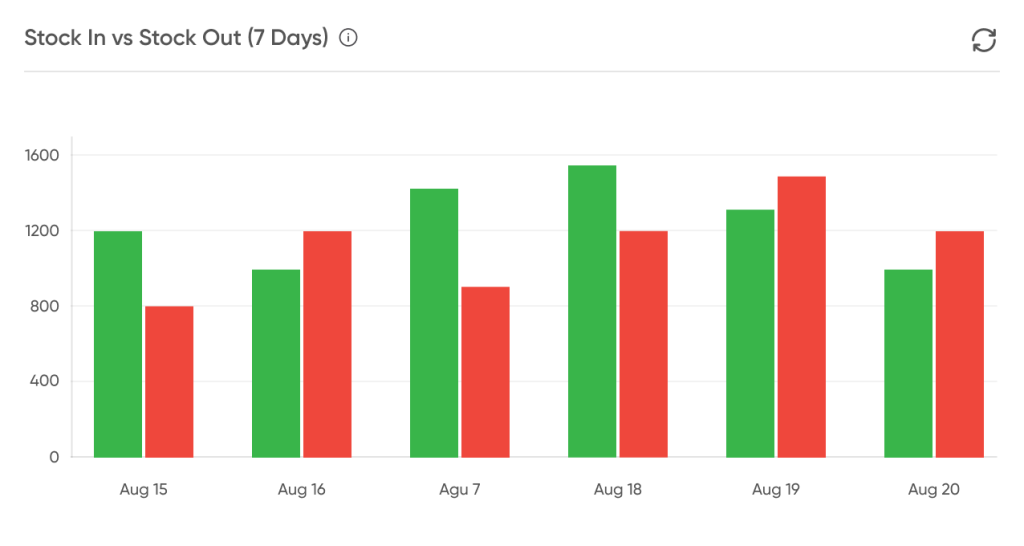
- Green Bars: Represent the total quantity of stock received ("Stock In").
- Red Bars: Represent the total quantity of stock dispatched ("Stock Out").
This chart helps you quickly identify trends in product movement and net inventory changes.
Product-wise Stock Distribution
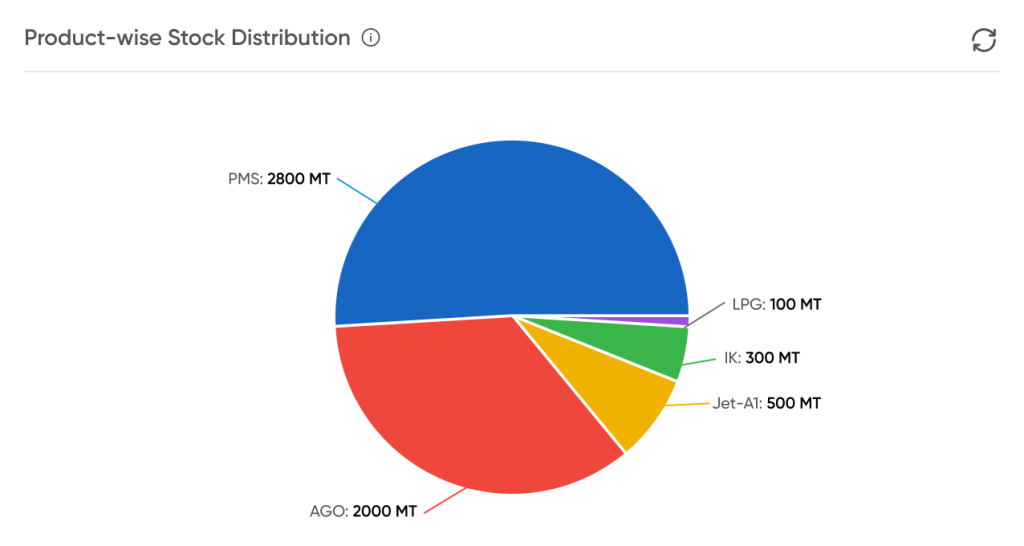
This pie chart illustrates the composition of your total inventory, showing the proportion of each product. Each slice represents a specific product and its current stock quantity in Metric Tons, allowing you to see which products dominate your inventory at a glance.
Planning vs Actual Stock Analysis
This bar chart compares the planned or budgeted stock levels against the actual on-hand inventory for each major product.
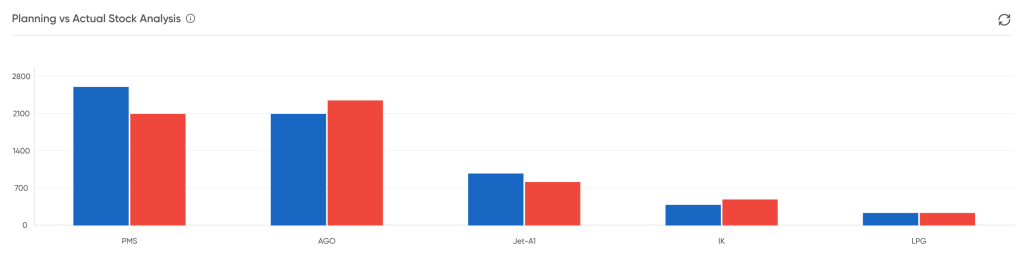
- Blue Bars: Represent the Actual inventory level.
- Red Bars: Represent the Planned inventory level.
This is a key tool for variance analysis, helping you assess the accuracy of your demand forecasting and purchasing.
Product Stock Summary & Variance
This section provides a detailed, side-by-side breakdown of each product's inventory status.
- Visual stylized tank graphics to show the level of product inside, making the capacity utilization percentage (e.g., 90.09%) instantly clear.
- It is designed to quickly communicate the health and distribution of inventory, focusing on how much storage capacity is being used and how much stock is committed to existing sales.
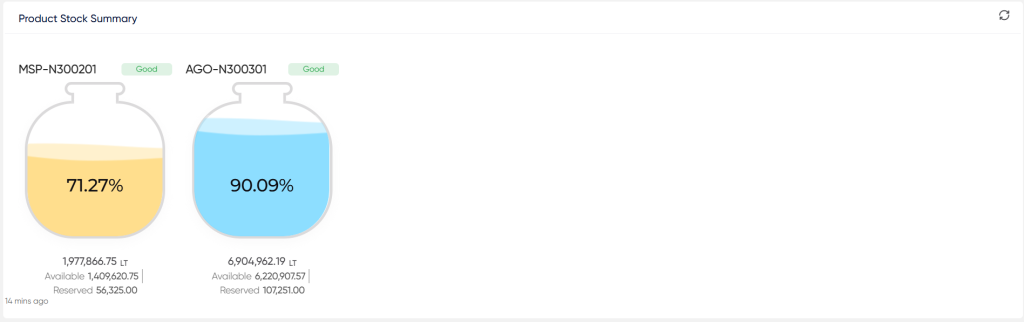
- Status Tag: A quick visual indicator of the stock level (e.g., Normal, Low, Good) based on pre-defined thresholds.
- Total Stock: The total physical quantity of the product.
- Available / Reserved: Breaks down the total stock into what is free to sell (
Available) and what is already committed to sales orders (Reserved).
Recent Stock Movements
- This table provides a real-time log of the latest inventory transactions.
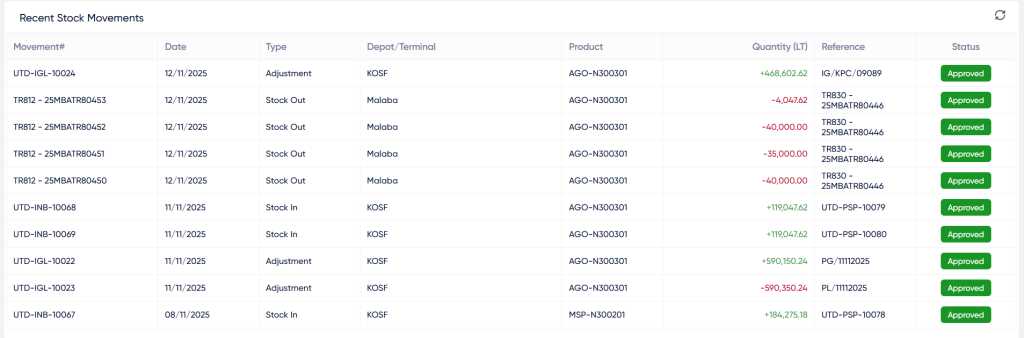
- Movement#: A unique identifier assigned to the specific stock movement record (e.g., UTD-IGL-10024 or TR812 - ZSMBATR80453).
- Date: The date the stock movement occurred.
- Type: The nature of the transaction (e.g., Stock In, Stock Out, Adjustment).
- Depot/Terminal: The physical location (depot or terminal) where the inventory change took place (e.g., KOSF or Malaba).
- Product: The specific product code that was moved (e.g., AGO-N300301 or MSP-N300201).
- Quantity [LT]: The volume of the product moved in Liters (LT), where a positive value indicates an inflow (Stock In/Gain) and a negative value indicates an outflow (Stock Out/Loss).
- Reference: A code linking the stock movement record to an external document or transaction (e.g., an invoice number, a system reference, or a waybill TR830 - ZSMBATR80446).

