Sales Dashboard
Introduction/Purpose
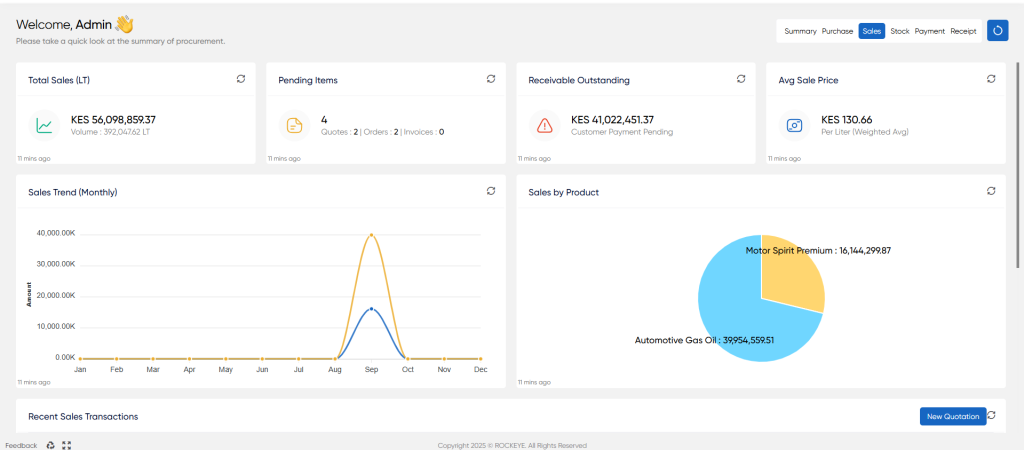
The Sales Dashboard is the central hub for monitoring all sales activities within the Rockeye Trade module. It provides a real-time, visual summary of sales performance, revenue generation, and the status of your sales pipeline for white products (oil).
This dashboard is designed for sales managers, account executives, and the finance department to quickly track key metrics, identify sales trends, analyze product performance, and manage customer receivables, all from one consolidated view.
Total Sales (MT)
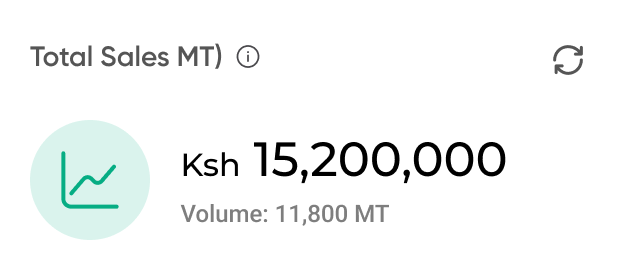
Total Sales (MT): Displays the total monetary value of sales for the current period. It also shows the corresponding sales volume in Metric Tons (MT), providing context to the revenue figure.
Pending Items
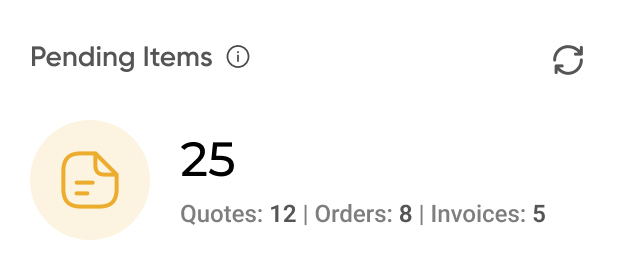
Pending Items: Summarizes the number of sales-related items currently in the pipeline that require action. It provides a breakdown by document type (Quotes, Orders, Invoices) to help identify potential bottlenecks in the sales cycle.
Receivales Outstanding
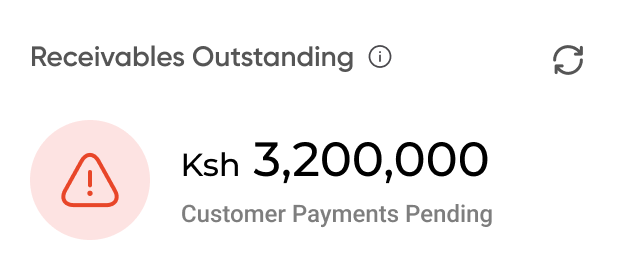
Receivables Outstanding: Highlights the total amount of money owed by customers from completed sales (i.e., customer payments that are pending). This is a critical metric for managing cash flow and accounts receivable.
Avg Sales Price
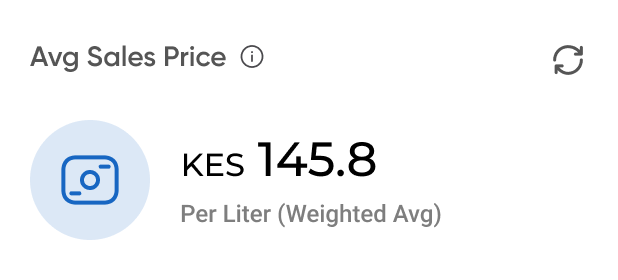
Avg Sales Price: Calculates the weighted average selling price per liter across all products. This metric is useful for tracking pricing strategy effectiveness and overall market performance.
Sales Trend (Monthly)
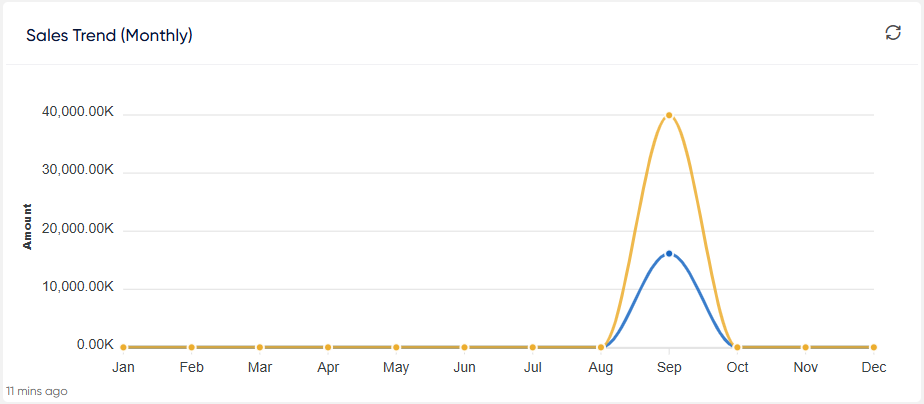
This line graph visualizes sales performance over time, typically over the last several months. It helps you identify patterns, seasonality, and the overall growth trajectory of your sales. The two lines could represent different key metrics, such as:
- Sales Volume vs. Sales Value
- Current Period Performance vs. a Target or Previous Period
Sales by Product
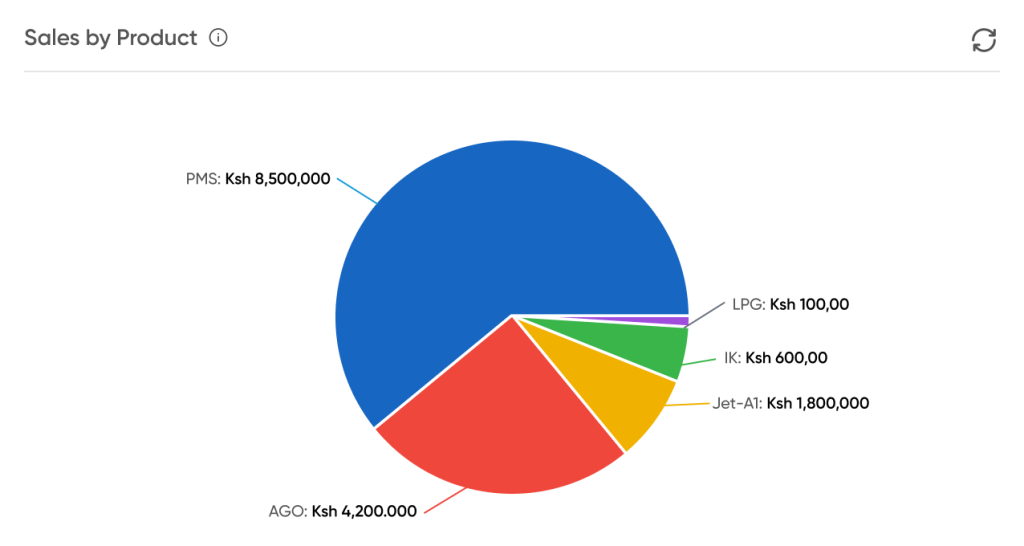
This pie chart provides a clear breakdown of revenue contribution by each product. Each slice of the pie represents a specific product (e.g., PMS, AGO, Jet-A1), and its size is proportional to its share of the total sales revenue. This widget is essential for quickly identifying your top-performing products and understanding your product mix.
Recent Sales Transactions
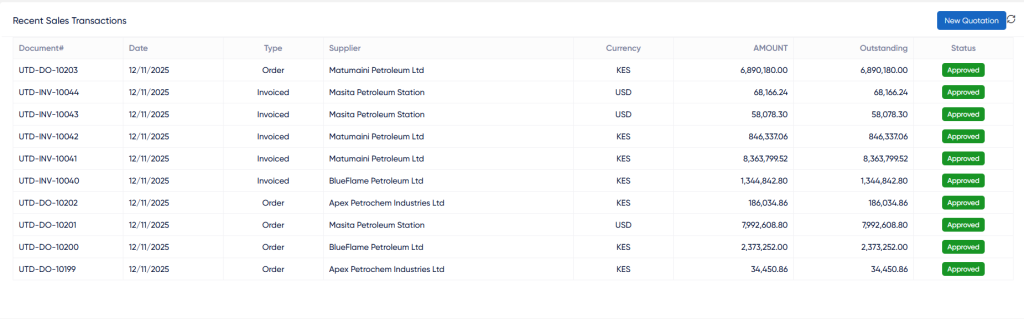
This table provides a live feed of the most recent sales transactions, allowing for quick access and status monitoring. It also includes a convenient + New Quotation button to initiate a new sales document directly from the dashboard.

