Purchase Dashboard
Introduction/Purpose
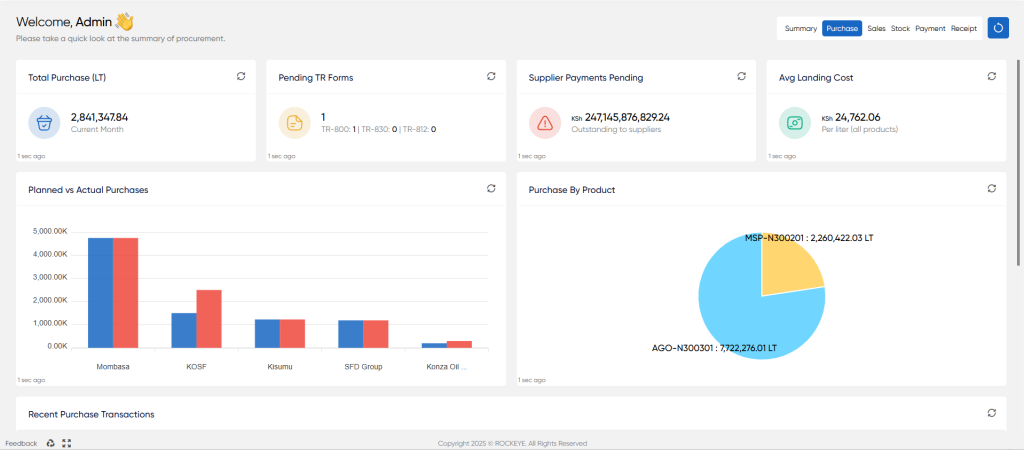
The Purchase Dashboard is your primary control center for monitoring all procurement activities related to your white product (oil) inventory. It offers a real-time, consolidated view of key purchasing metrics, cost breakdowns, and transaction statuses.
Designed for procurement managers and finance teams, this dashboard enables you to track spending, identify potential bottlenecks in the supply chain, analyze landed costs, and manage supplier payments effectively, all from a single screen
Total Purchase (MT)
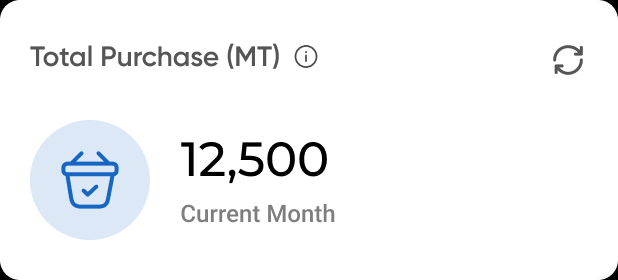
Total Purchase (MT): Displays the total volume of product, in Metric Tons, procured within the current month.
Pending TR Forms
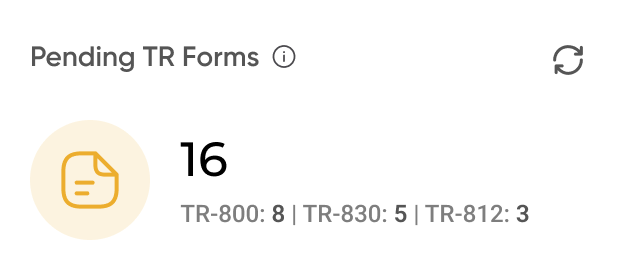
Pending TR Forms: Shows the total count of outstanding Transfer Request (TR) forms that require action. It also provides a breakdown by form type (e.g., TR-800, TR-830, TR-812) to pinpoint specific backlogs.
Supplier Payments Pending
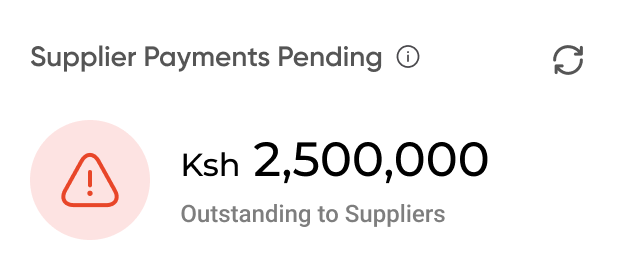
Supplier Payments Pending: Highlights the total monetary value outstanding to all suppliers. This is a critical metric for managing accounts payable and maintaining healthy supplier relationships.
Avg Landing Cost
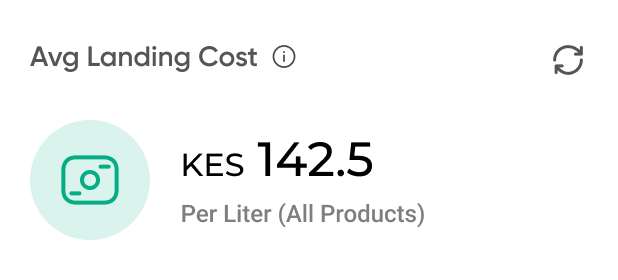
Avg Landing Cost: Calculates the average cost per liter for all products, including the base product price plus all associated costs (transport, insurance, etc.). This is the true cost of acquiring your inventory.
Planned vs Actual Purchases
This bar chart provides a visual comparison of planned procurement volumes against the actual volumes received at different locations.
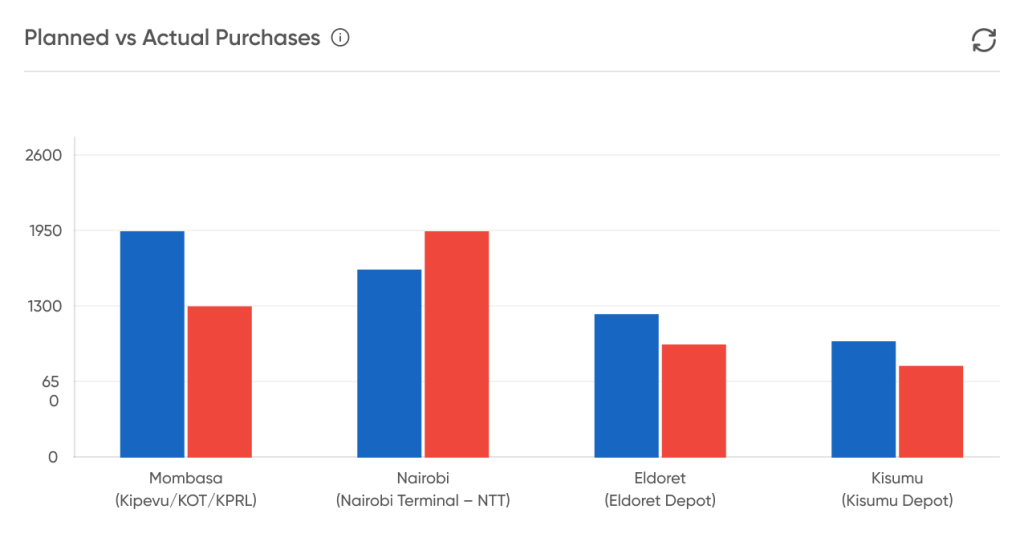
- Blue Bars: Represent the planned or budgeted purchase quantity for each terminal.
- Red Bars: Represent the actual quantity of product purchased and received.
This chart is essential for identifying variances in your purchasing strategy and understanding terminal-specific performance.
Purcase By Product
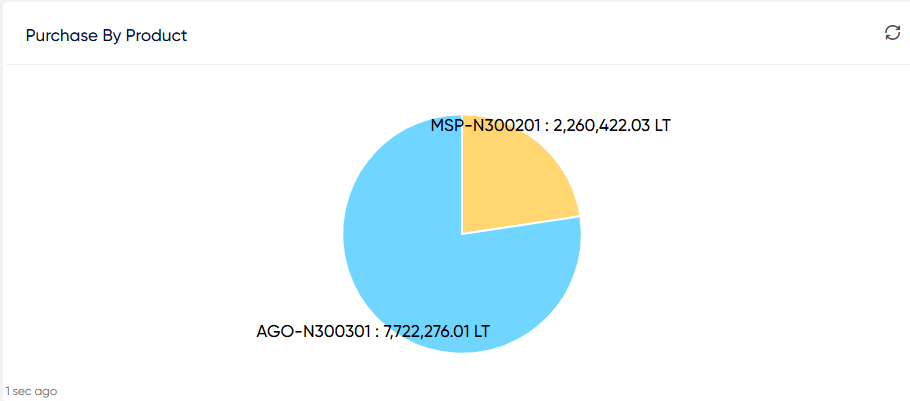
This pie chart visualizes the different purchase volumes that contribute to your total procurement quantity, showing the share of the total liters purchased for each product category. This helps you understand where your procurement spending (by volume) is concentrated.
Recent Purchase Transactions
This table provides a real-time log of the most recent purchase transactions, allowing for quick tracking and status checks.
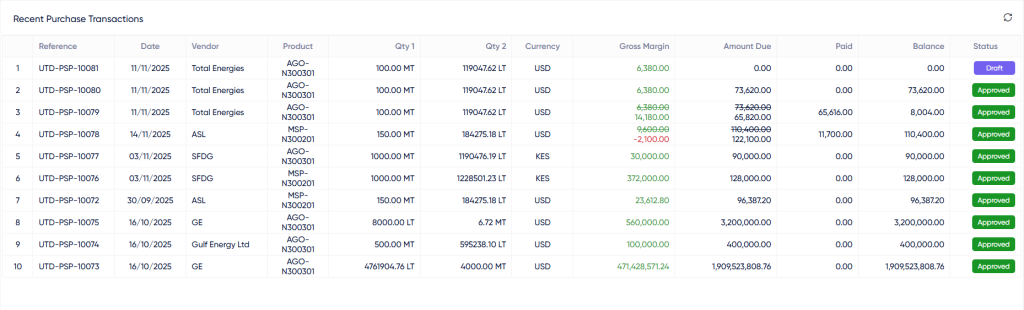
- Reference: The unique transaction identifier or code assigned to this specific purchase order or receipt.
- Date: The date the purchase transaction was recorded or completed.
- Vendor: The name of the company or supplier from whom the product was purchased.
- Product: The specific product code that was purchased (e.g., AGO-N300301 or MSP-N300201).
- Qty 1: The primary quantity of the product purchased, including the Unit of Measure (UOM) like Metric Tons (MT) or Liters (LT).
- Qty 2: A secondary or converted quantity for the product, including its UOM, used for costing or inventory tracking.
- Currency: The currency in which the transaction's financial amounts are recorded (e.g., USD or KES).
- Gross Margin: The calculated profit margin expected or achieved on this purchase when compared to a defined selling price or market cost.
- Amount Due: The total monetary value payable to the vendor for this purchase transaction.
- Paid: The portion of the Amount Due that has already been paid to the vendor.
- Balance: The remaining monetary amount still owed to the vendor, calculated as Amount Due minus Paid.
- Status: The current processing state of the transaction (e.g., Draft or Approved).

