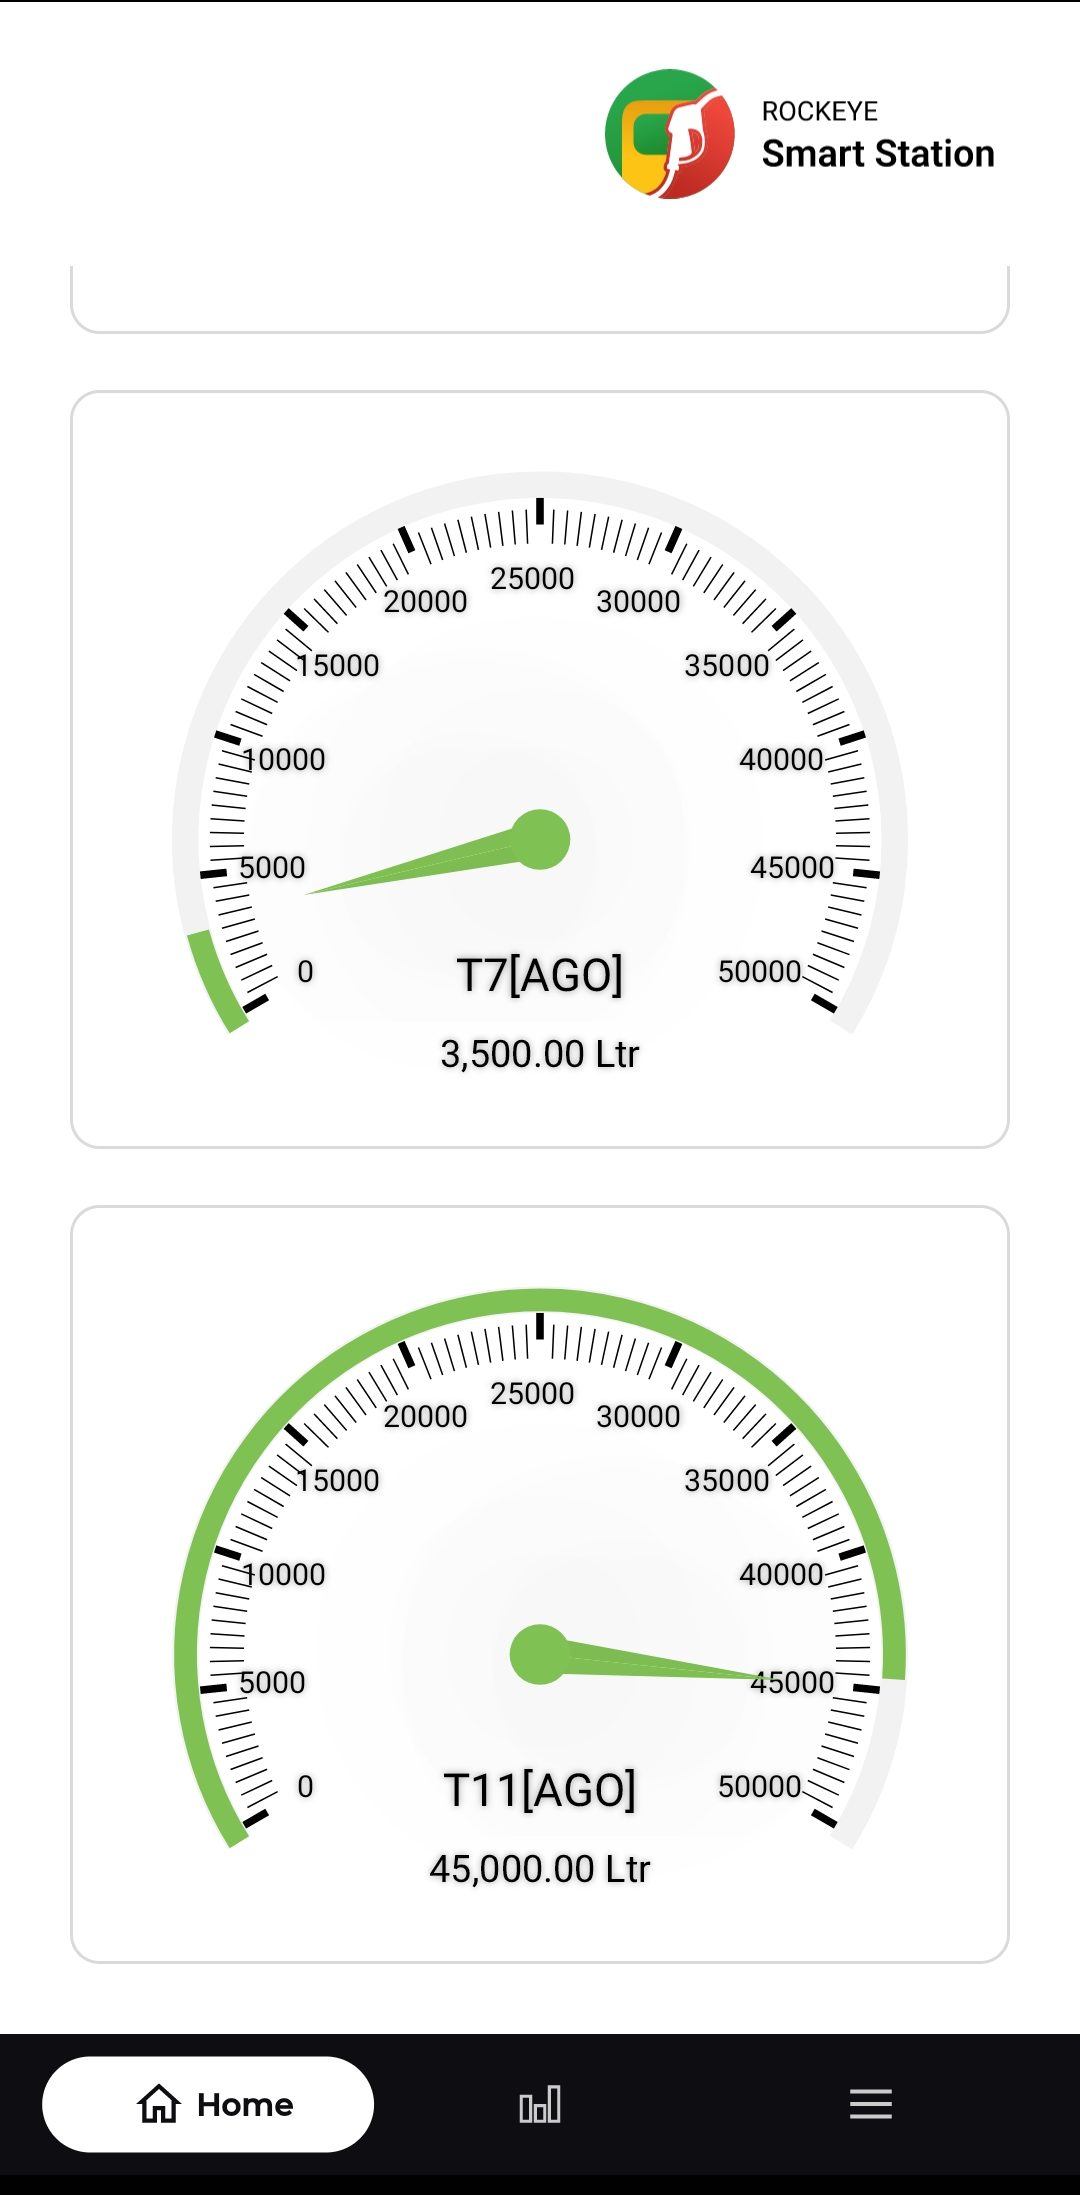
Stock Overview
3.1 Introduction / Purpose
The Stock Overview screens give a consolidated, visual view of fuel stock levels — first as an aggregate daily-sales breakdown by liquid product, then as per-tank gauge readings for PMS and AGO.
3.2 How to Navigate
- From the Home dashboard, tap the Stock Account tile to open the Stock Overview screens.
- The first screen, “Product Stock Daily Sales,” opens showing a pie chart.
- Scroll down to view “Product Stock Analytics,” a list of products with total quantities.
- Continue to the “Tanks Stock” screen, which shows individual tank gauges.
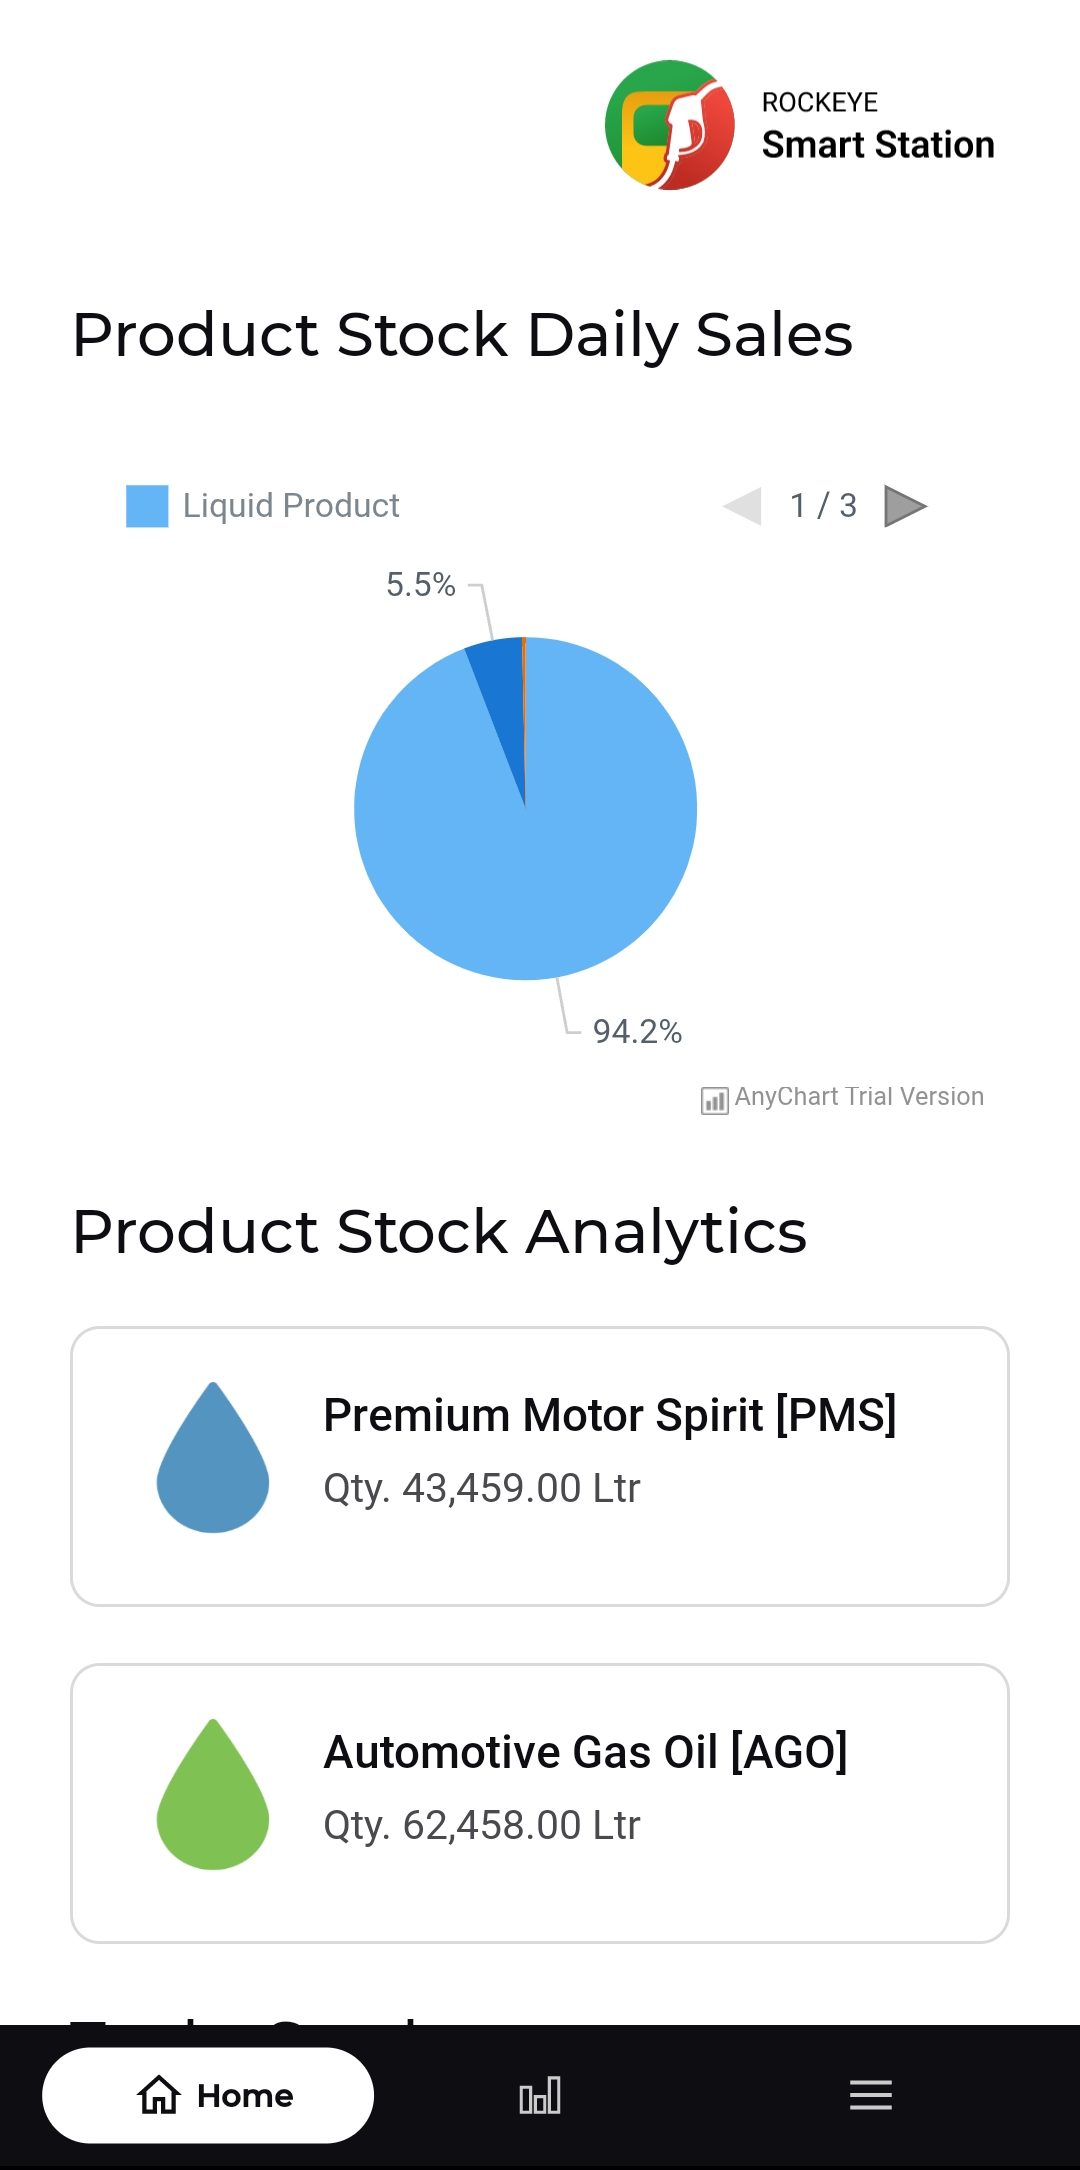
3.2.1 Product Stock Daily Sales (Pie Chart)
- Displays the proportion of Liquid Product sold as percentages (e.g. 94.2% and 5.5%).
3.2.2 Product Stock Analytics (List)
Each liquid product is listed with its total quantity:
3.2.3 Tanks Stock (Gauges)
Each tank card shows its code, product, gauge, and exact quantity
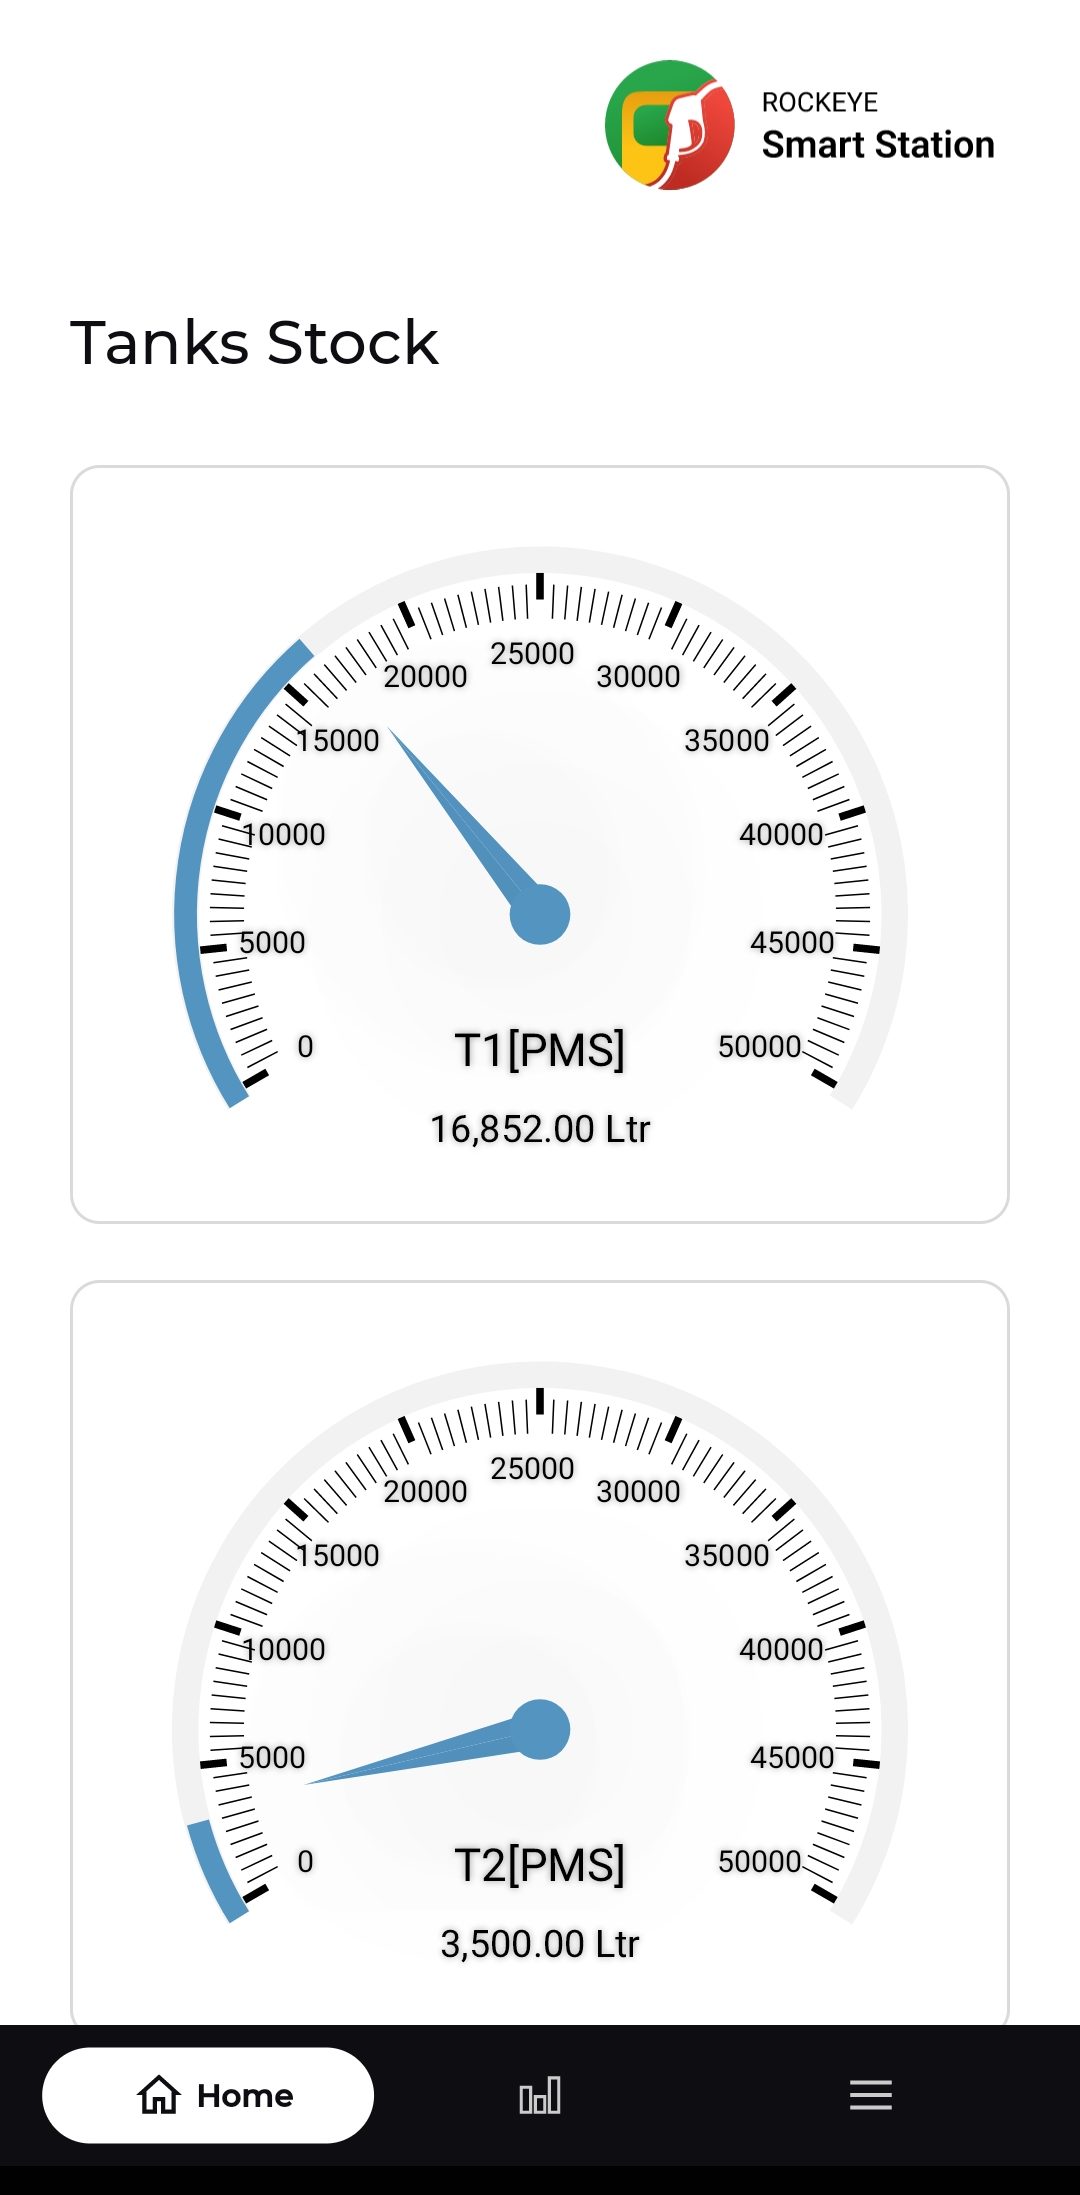
3.3 Other Applicable Actions
- Use the pagination arrows on the pie chart to view additional stock-sales breakdowns.
- Scroll through the Tanks Stock list to review every tank at the station.
Note: Stock Overview is a read-only reporting screen — no add or edit actions are available here.