Navigation
- Side Menu >> Dashboard
Introduction/Purpose
The smart tracking system features a comprehensive dashboard, providing users with an intuitive interface to monitor and manage their vehicles efficiently.
With real-time updates, and insightful analytics, the dashboard empowers users to make informed decisions and optimize their fleet operations effectively.
Dependencies
- System Performance: System should respond properly to retrieve and process data accurately.
- Data Availability: The dashboard relies on real-time and historical data from tracking devices installed in vehicles. It assumes that these devices are operational and transmitting data as expected.
- Databases: The dashboard depends on the accurate data of several databases like, Route, Trip, Vehicle, Drivers, Alerts etc.
- Proper Data Management: Proper data indexing and retrieval mechanisms are responsible to ensure efficient dashboard performance.
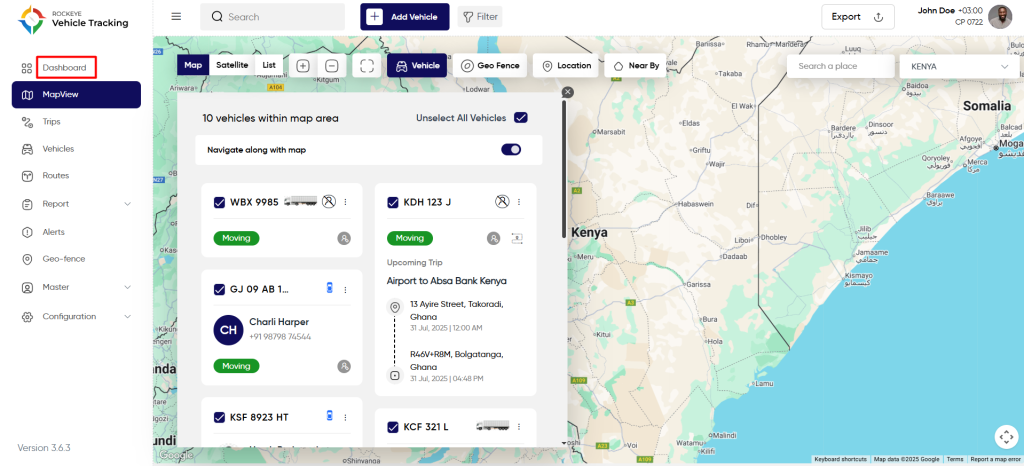
Navigation To Dashboard
The navigation to access the Dashboard typically involves the following steps:
- Click On The Dashboard Icon: A click on Dashboard in the side navigation menu, the user is redirected to Dashboard.
Summary
In the summary dashboard of vehicle tracking, you can have the real time information related to vehicles, drivers, trips, alerts, routes and many more. This dashboard consists of a lot of KPIs defined in the system and you can easily and efficiently apply date filters to the KPIs and have date specific data.
Few of the KPIs are listed below:
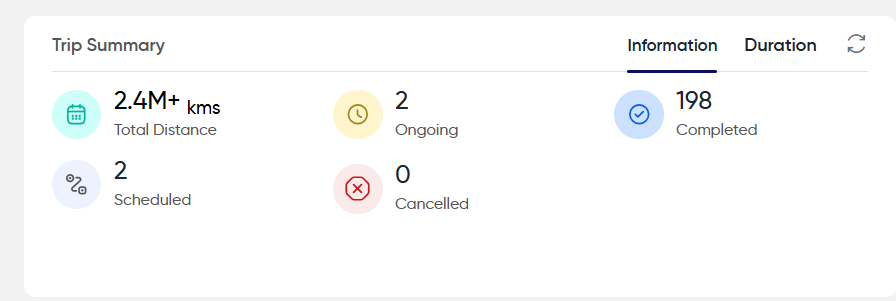
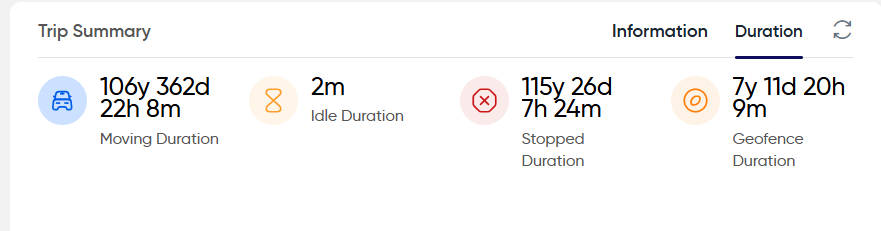
Trip Summary:
User will be able to view the “Trip Summary” and also can able to get the trip summary information with various aspects such are
- Total Distance
- Number of ongoing
- Number of Completed
- Number of Scheduled
- Number of Cancelled
- Duration of the trip at moving / Idle duration / Stopped duration / Geofence duration
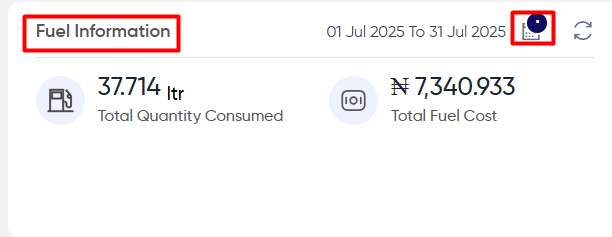
Fuel Information:
User will be able to access the total qty consumed fuel information & tota fuel cost. user can also apply filter with specific data range for this fuel information.
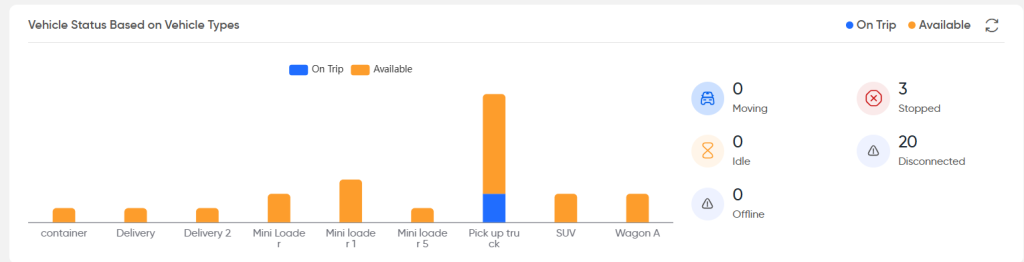
Vehicle status based on vehicle types :
User will be able to view the status of the trips based on vehicle groups. can also see the stage of the vehicle whether its idle / moving / disconnected / offline
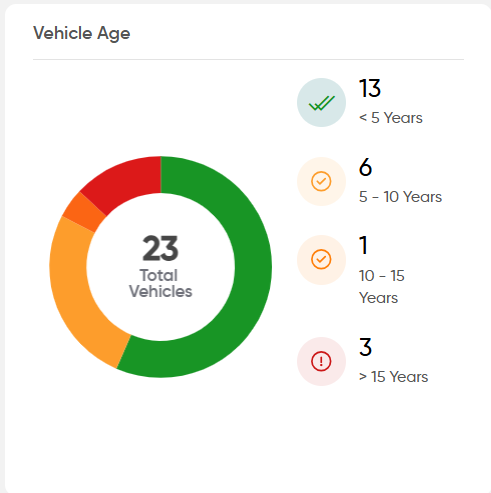
Vehicle Age:
User will be able to view the graphical representation of the vehicle aging with different age ranges.
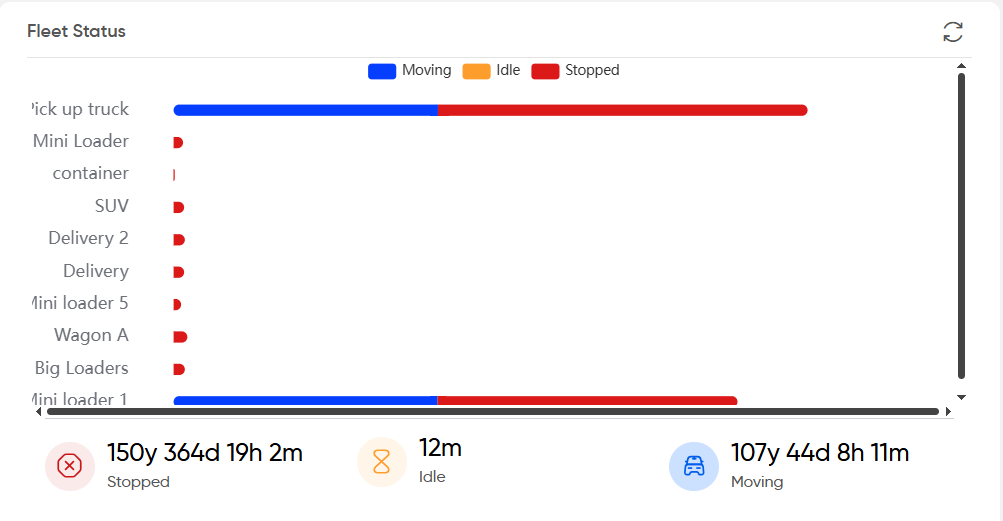
Fleet Status :
User will be able to view the fleet status of the vehicle group whether its moving / Idle / stopped. user also can view the duration of the trips from each stage.
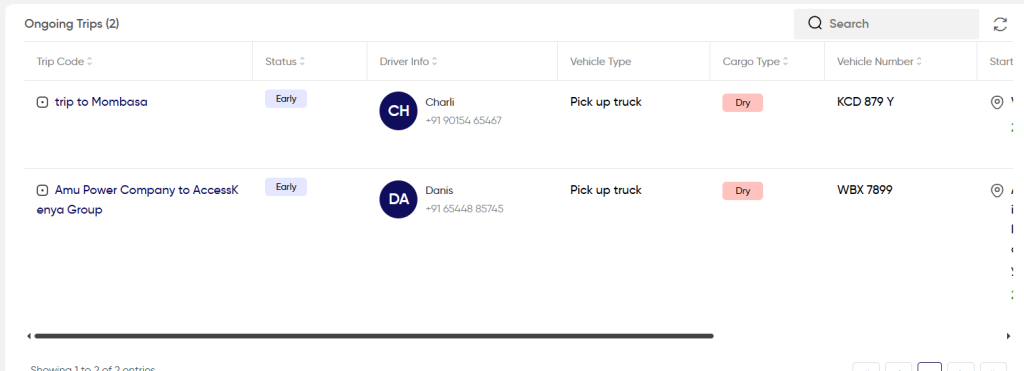
Ongoing Trips:
User will be able to view the ongoing trips with the following details
- Trip code
- Status
- Driver info
- Vehicle type
- Cargo type
- Vehicle number
- Start route
- Stops
- End route
Vehicles
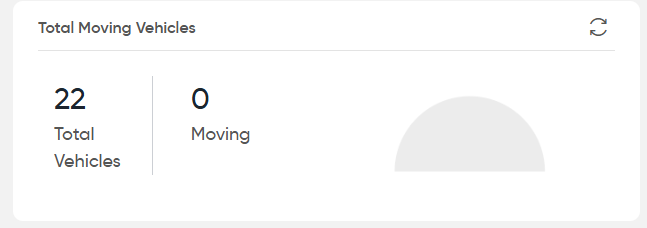
Total Moving Vehicles:
User will be able to view the “Number of moving vehicles” and the number of total active vehicles
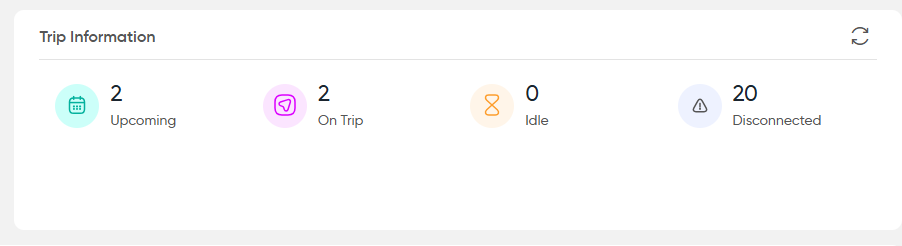
Trip Information
User will be able to view the following trip information
- Number of upcoming
- On Trip
- Number of idle
- Number of disconnected
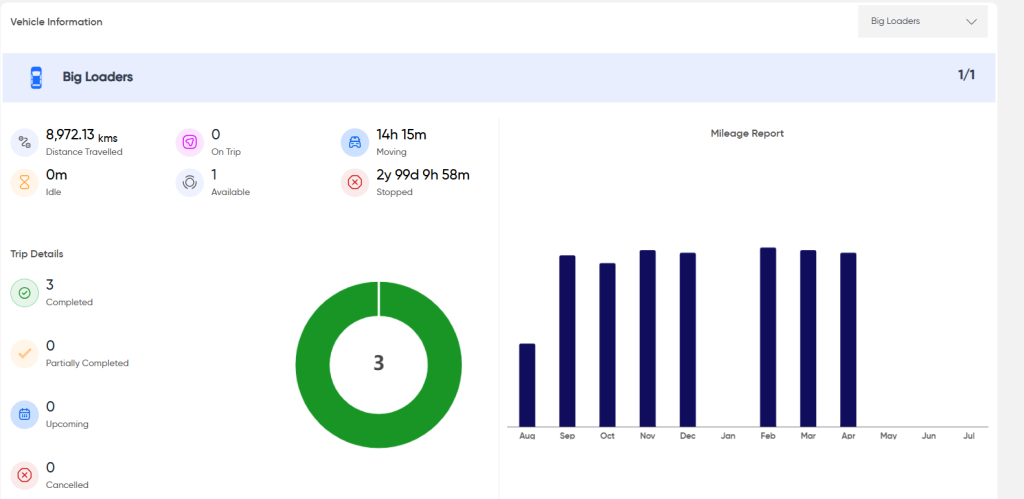
Vehicle Information
User will be able to view the vehicle details by choosing the specific vehicle grouo from the dropdown. user will be able to see the following information from the trips
- Distance travelled
- On trip
- Moving
- Idle
- Available
- Stoppage
User will be able to view the stastical & graphical representation of trip details
User will be able to view the graphical representation of month-wise mileage report
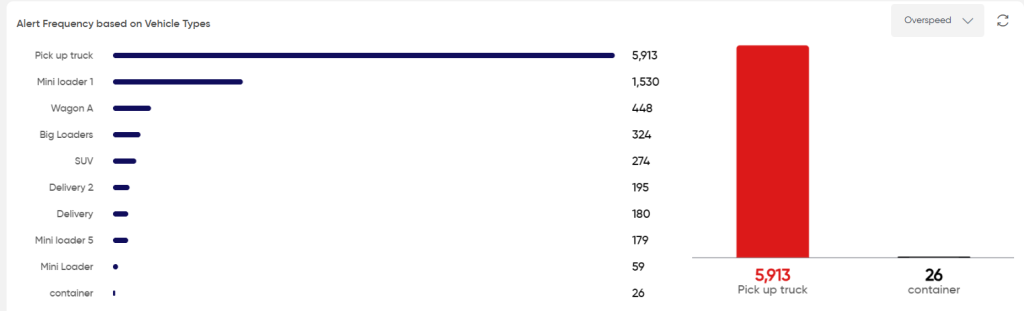
Alert Frequency based on Vehicle Types:
User will be able to view the number of alerts with different vehicle types by choosing the specific alert from dropdown.
User can see the graphical & stastical representation of the count of alerts with different vehicle types.
Drivers
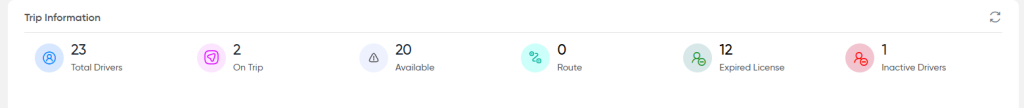
Trip Information:
User will be able to view the driver information under different stages in the trips
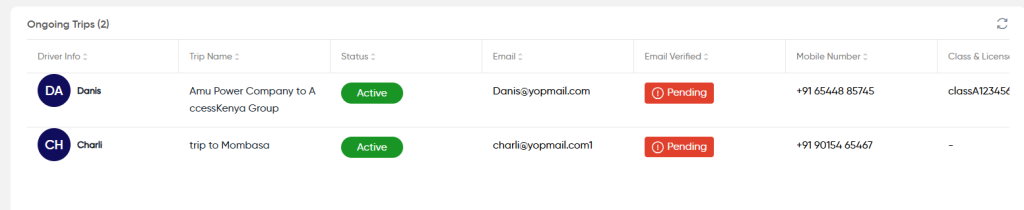
Ongoing Trips
User will be able to view the driver information under ongoing trip
Non-Moving Assets
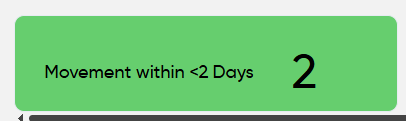
Movement within <2 Days:
User will be able to view the statistical count of the non moving vehicles within < 2 days.
No Movement 2-6 Days:
User will be able to view the statistical count of the non moving vehicles within 2-6 days.

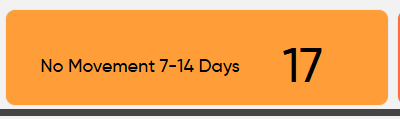
No Movement 7-14 Days:
User will be able to view the statistical count of the non moving vehicles within 7-14 days.
No Movement 15-30 Days:
User will be able to view the statistical count of the non moving vehicles within 15-30 days.

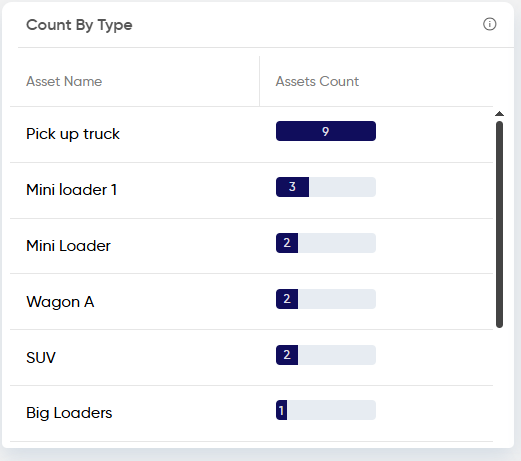
Count By Type:
User will be able to view the statistical count of non moving assets under different asset types
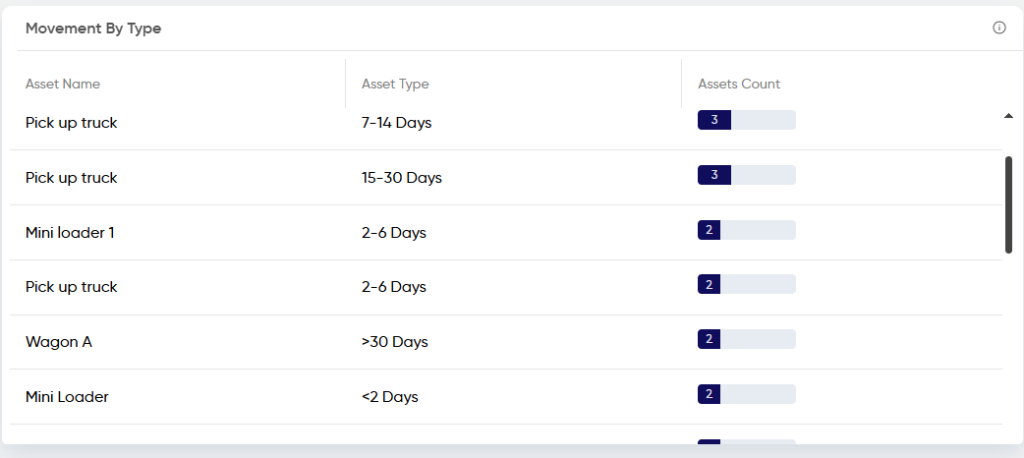
Movement By Type:
User will be able to view the statistical count of non moving assets under different asset vehicle type and time period.
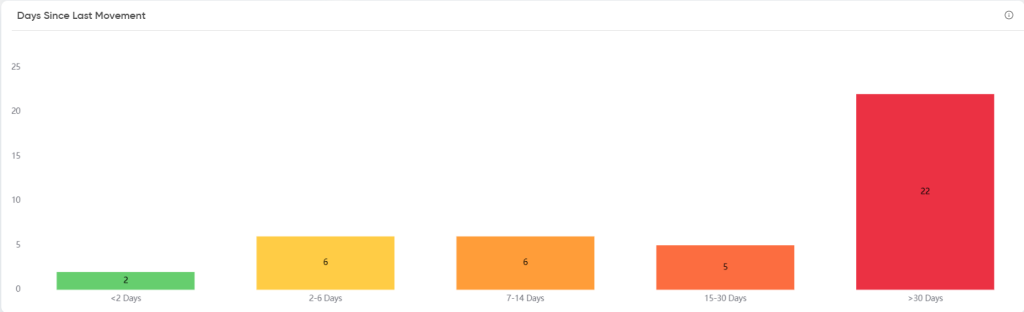
Days Since Last Movement:
User will be able to view the graphical count of the non moving vehicles within different duration.
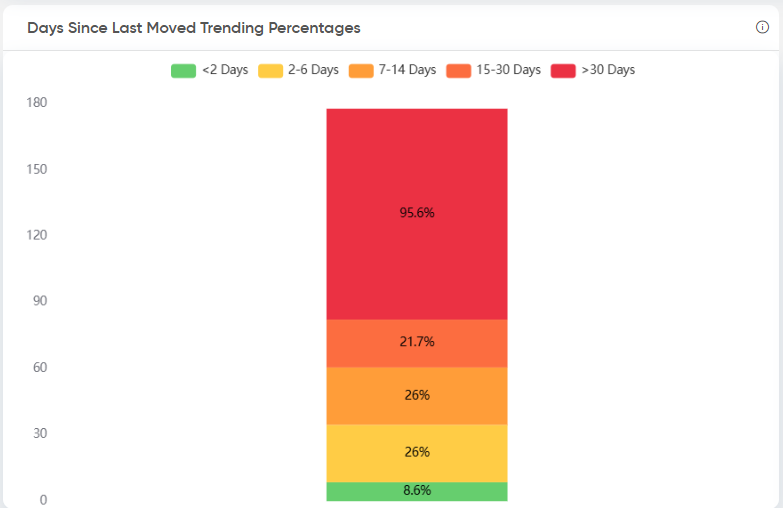
Days Since Last Moved Trending Percentages:
user will be able to view the graphical representation of the non moving vehicles in % with different day ranges.
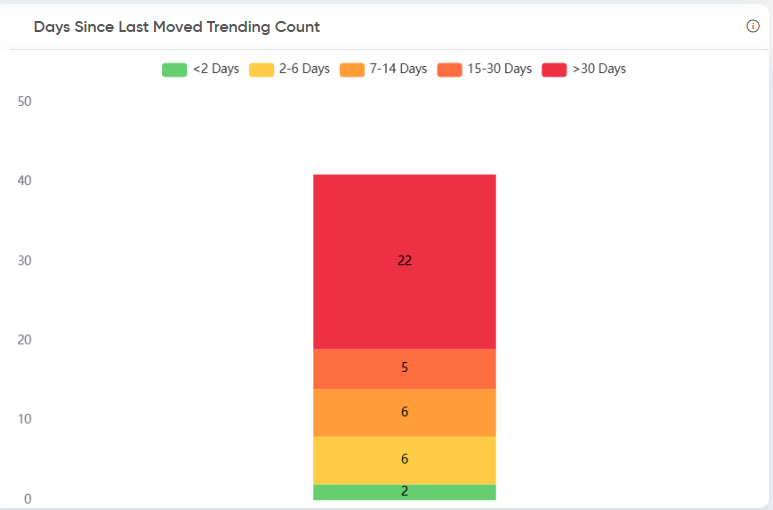
Days Since Last Moved Trending Count:
user will be able to view the graphical representation of the non moving vehicles in count wise with different day ranges.
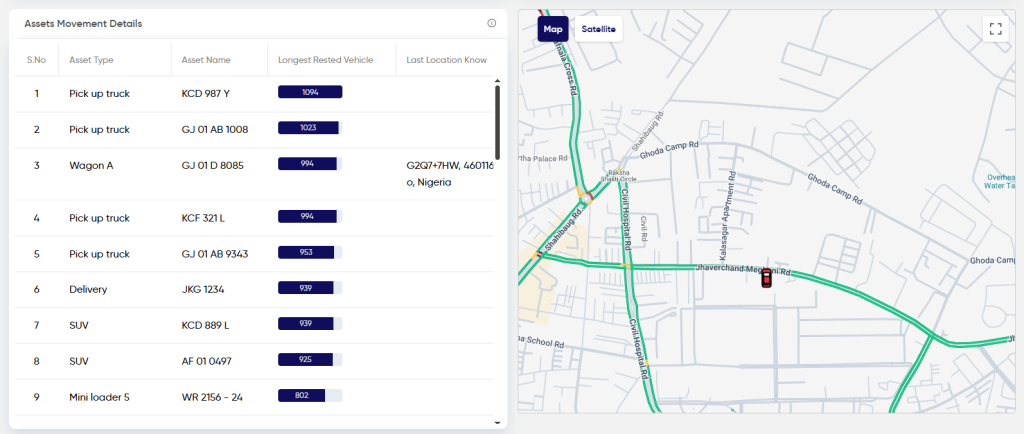
Assets Movement Details:
User will beable to view the statistical representation of the non moving assets with the following details
- Asset type
- Asset Name
- Longest Rested Vehicle
- Last Location Know
User can also view the vehicle from the map by clicking on the specific vehicle number.