Transport Management
Logistics
Transporters:
- Users will be able to view the number of transporters from this widget in the logistics section.
- Users will be able to use the refresh icon. When users click the refresh icon, the “transporters” kpi will be updated.
- Users will be able to use the refresh icon which is at top right corner, the entire logistics sections will be updated.
Vehicles:
- Users will be able to view the number of vehicles from this widget in the logistics section.
- Users will be able to use the refresh icon. When users click the refresh icon, the “vehicles” kpi will be updated.
- Users will be able to use the refresh icon which is at top right corner, the entire logistics sections will be updated.
In Use Vehicles:
- Users will be able to view the number of vehicles in use from this widget in the logistics section.
- Users will be able to use the refresh icon. When users click the refresh icon, the “In -Use Vehicles” kpi will be updated.
- Users will be able to use the refresh icon which is at top right corner, the entire logistics sections will be updated.
Available Vehicles:
- Users will be able to view the number of vehicles available for a trip from this widget in the logistics section.
- Users will be able to use the refresh icon. When users click the refresh icon, the “Available Vehicles” kpi will be updated.
- Users will be able to use the refresh icon which is at top right corner, the entire logistics sections will be updated.
Tracker Disabled:
- Users will be able to view the number of tracker disabled vehicles from this widget in the logistics section.
- Users will be able to use the refresh icon. When users click the refresh icon, the “Tracker Disabled” kpi will be updated.
- Users will be able to use the refresh icon which is at top right corner, the entire logistics sections will be updated.
Tracker Enabled:
- Users will be able to view the number of tracker enabled vehicles from this widget in the logistics section.
- Users will be able to use the refresh icon. When users click the refresh icon, the “Tracker Enabled” kpi will be updated.
- Users will be able to use the refresh icon which is at top right corner, the entire logistics sections will be updated.
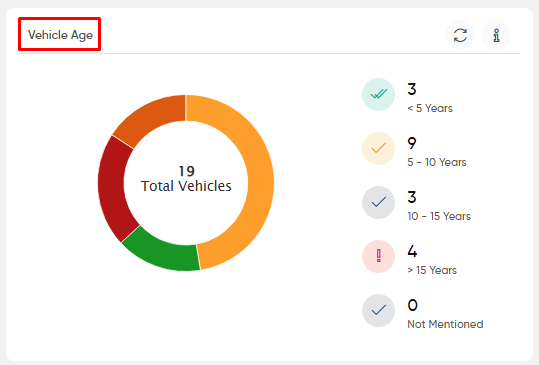
Vehicle Age:
- Users can view the number of vehicles categorized by different age ranges, such as under 5 years, 5 to 10 years, 10 to 15 years, and above 15 years.
- The widget provides both graphical and statistical representations of this data, allowing users to easily see the total number of vehicles as well.
- By hovering over the graph, users can view the count of vehicles within each specific age range.
- A refresh icon is available, enabling users to update the “Vehicle Age” KPI for the most current information.
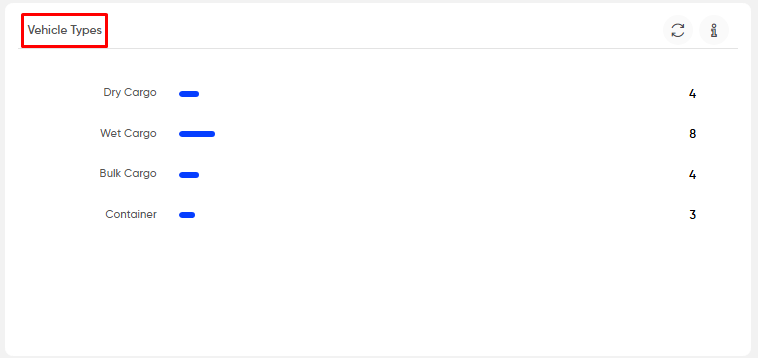
Vehicle Types:
- Users can view the count of different vehicle types, including dry, wet, container, and bulk.
- This widget features a graphical representation along with the corresponding statistical values.
- By hovering over the graph, users can see the count of vehicles for each specific type.
- A refresh icon is available, allowing users to update the “Vehicle Types” KPI to ensure access to the most current information.
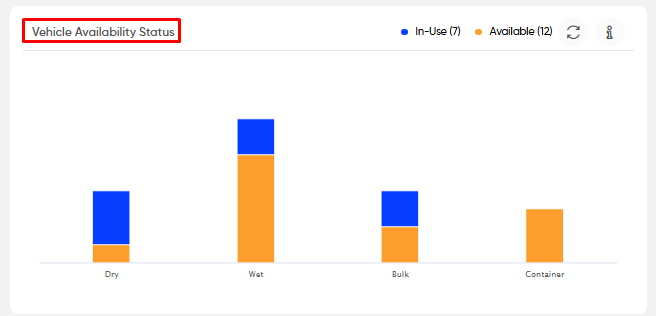
Vehicle Availability Status:
- Users can view a graphical representation of vehicle availability status, including categories for “In Use” and “Available.”
- This widget displays the count of vehicles corresponding to each status.
- By hovering over the graph, users can see the specific count of vehicles for each category.
- A refresh icon is available, allowing users to update the “Vehicle Availability Status” KPI to access the most current information.
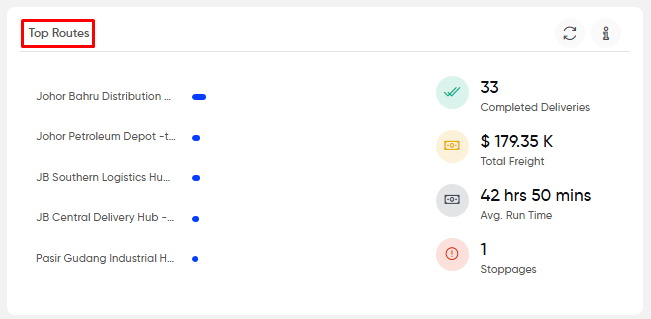
Top Routes :
- Users can view a graphical representation of deliveries along specific top routes.
- This widget provides statistical values for completed deliveries, total freight, average run time, and stoppages.
- Users can see the count of completed deliveries and stoppages, along with the total freight value and average run time.
- By hovering over the graph, users can view the specific count of deliveries for each route.
- A refresh icon is available, allowing users to update the “Top Routes” KPI to access the most current information.
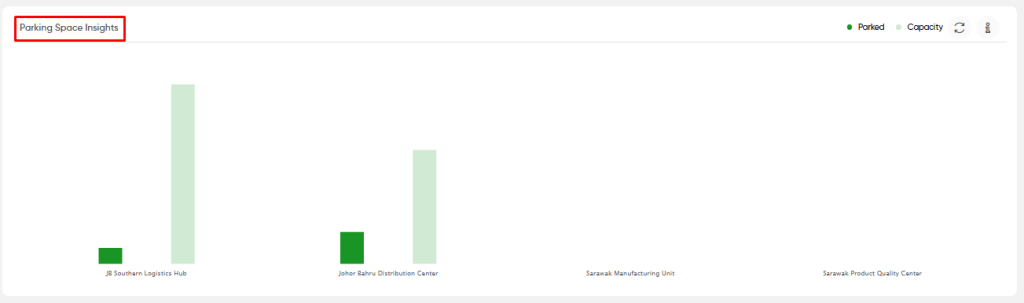
Parking Space Insights :
- Users can view a graphical representation of parking space insights, showcasing both graphical and statistical counts of total capacity and the number of vehicles parked.
- By hovering over the graph, users can access specific details about the capacity and parked count for each parking space.
- A refresh icon is available, allowing users to update the “Parking Space Insights” KPI to access the most current information.