Transport Management
Fuel
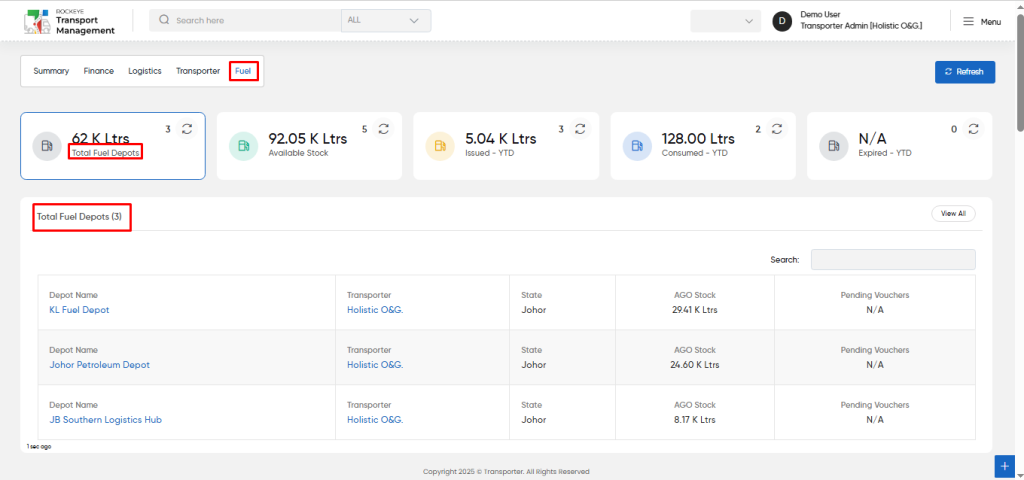
Total Fuel Depots:
- Users will be able to view the total quantity of fuel and count in fuel depots from this widget in the fuel section.
- Users will be able to use the refresh icon. When users click the refresh icon, the “total fuel depots” kpi will be updated.
- Users will be able to use the refresh icon which is at top right corner, the entire fuel sections will be updated.
- Users will be able to view all “total fuel depots” by accessing the “view all” button.
- Users will be able to search the fuel depots related data from the search box for the upcoming section.
- User will be able to view the fuel depots data with the following
- Depot Name
- Transporter
- State
- Fuel stock
- Pending vouchers
Available Stock:
- Users will be able to view the total quantity of fuel and count in available stock from this widget in the fuel section.
- Users will be able to use the refresh icon. When users click the refresh icon, the “available stock” kpi will be updated.
- Users will be able to use the refresh icon which is at top right corner, the entire fuel sections will be updated.
- Users will be able to view all “available stock” by accessing the “view all” button.
- Users will be able to search the fuel available stock related data from the search box for the upcoming section.
- User will be able to view the available stock data with the following
- Depot Name
- Transporter
- Product
- Available Quantity
- WAC
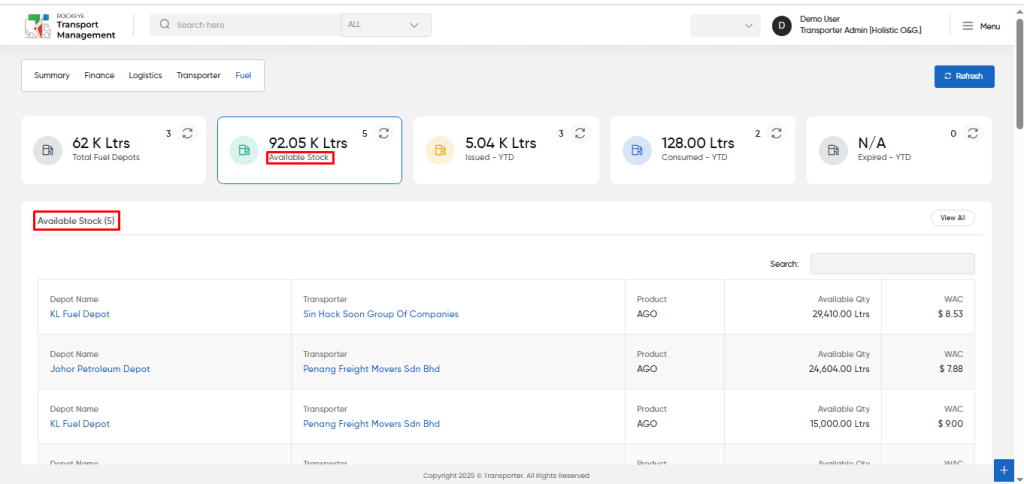
Fuel Issued – YTD:
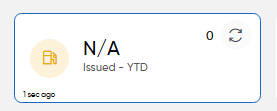
- Users will be able to view the total quantity of fuel and count in “Issued – YTD” from this widget in the fuel section.
- Users will be able to use the refresh icon. When users click the refresh icon, the “Issued – YTD” kpi will be updated.
- Users will be able to use the refresh icon which is at top right corner, the entire fuel sections will be updated.
Fuel Consumed – YTD:
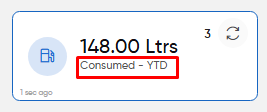
- Users will be able to view the total quantity of fuel and count in “Consumed – YTD” from this widget in the fuel section.
- Users will be able to use the refresh icon. When users click the refresh icon, the “Consumed – YTD” kpi will be updated.
- Users will be able to use the refresh icon which is at top right corner, the entire fuel sections will be updated.
Fuel Expired – YTD:
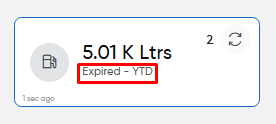
- Users will be able to view the total quantity of fuel and count in “Expired – YTD” from this widget in the fuel section.
- Users will be able to use the refresh icon. When users click the refresh icon, the “Expired – YTD” kpi will be updated.
- Users will be able to use the refresh icon which is at top right corner, the entire fuel sections will be updated.
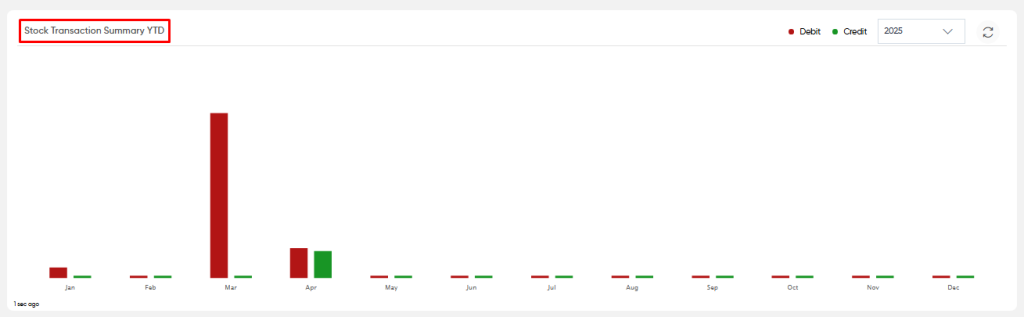
Stock Transaction Summary YTD:
- Users will be able to view the credit and debit of fuel stock transactions, displayed month-wise within a given year.
- This data is presented in a graphical format, allowing for an easy visual analysis of fuel stock movements over time.
- By selecting a specific year from the dropdown menu, users can view the fuel stock transaction data for each month, categorized into credit and debit.
- While hovering the cursor over the graph reveals specific values for each month’s credit and debit quantities, enabling detailed analysis.
- A refresh icon is available to update the “Stock Transaction Summary YTD” graph, ensuring users always have the most current financial data at their disposal.
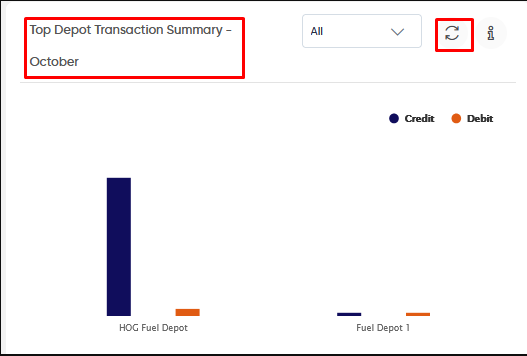
Top Depot Transaction Summary – current month:
- Users can view the credit and debit fuel transactions for the top fuel depots in a graphical representation for the current month.
- By default, this widget displays fuel transaction quantities, categorized by credit and debit, across the top depots.
- Users can filter the data by selecting a specific fuel type, such as AGO, PMS, DPK, or “All,” from the dropdown menu to display transaction details specific to that fuel type for the current month.
- Hovering over an eye icon provides a brief explanation of the data displayed.
- Additionally, hovering over the graph reveals detailed fuel quantity values for credit and debit transactions, offering a deeper insight into fuel stock movements per depot.
- A refresh icon is available to update the “Top Depot Transaction Summary – [Current Month Name]” graph, ensuring users always have access to the latest fuel transaction data.
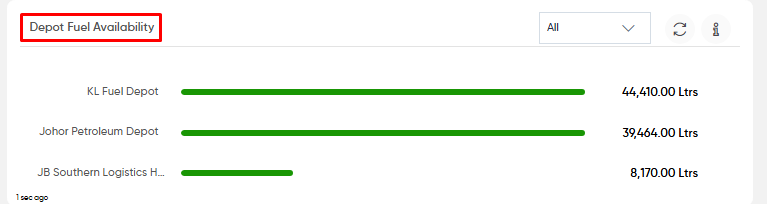
Depot Fuel Availability :
- Users can view the fuel availability across different depots through a graphical representation that highlights the statistical quantity of fuel stocked in each depot.
- By selecting a specific fuel type from the dropdown menu, users can access detailed information on the available quantity of that fuel across various depots.
- This data is presented in a graphical format, making it easier to analyze fuel availability in each location visually.
- Hovering over an eye icon provides a brief explanation of the displayed data.
- Additionally, users can hover over the graph to reveal specific values, allowing for a more in-depth understanding of fuel stock availability per depot.
- A refresh icon is available to update the “Depot Fuel Availability” graph, ensuring users always have access to the latest fuel availability data.
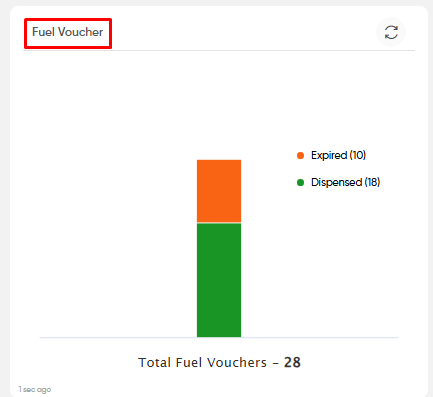
Fuel Voucher :
- Users can view a graphical representation of fuel voucher statuses, categorized as “Dispensed” or “Expired.”
- This widget provides insights into the overall count of fuel vouchers in each status.
- Hovering over the graph reveals specific counts for both dispensed and expired vouchers, allowing users to analyze the distribution in detail.
- A refresh icon is available to update the “Fuel Voucher” graph, ensuring access to the most current voucher data.
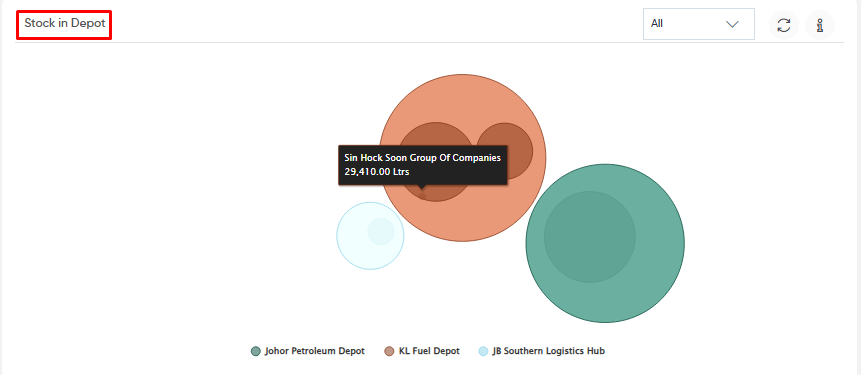
Stock in Depot :
- Users will be able to view the total fuel quantity available in various fuel depots, categorized by transporter.
- This widget provides a detailed view of fuel stock availability across different transporters within each fuel depot.
- Users can filter the data by selecting a specific fuel type or choose the “All” option to see the total available fuel quantity across all transporters in all fuel depots.
- By hovering over an eye icon, users can access a brief explanation of the displayed data.
- Hovering the cursor over the graph reveals specific quantity values for each fuel type, transporter, and depot, offering a deeper understanding of fuel stock distribution.
- A refresh icon is available to update the “Stock In Depot” graph, ensuring access to the most up-to-date data.
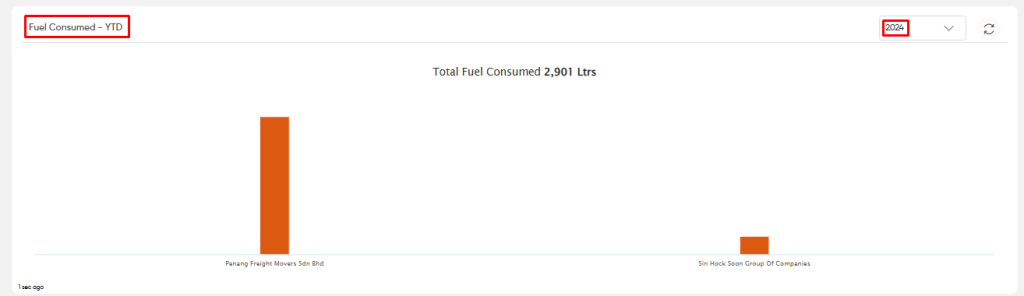
Fuel Consumed – YTD :
- Users can view the total fuel consumption for the year-to-date (YTD) across different transporters in a graphical representation.
- This widget provides insights into the total quantity of fuel consumed, displayed both graphically and statistically.
- Users can select a specific year from the dropdown menu, allowing them to filter and view the fuel consumption data for that particular year.
- By hovering the cursor over the graph, users can see the detailed consumed fuel quantity for each transporter.
- A refresh icon is available to update the “Fuel Consumed – YTD” graph, ensuring access to the most current fuel consumption data.
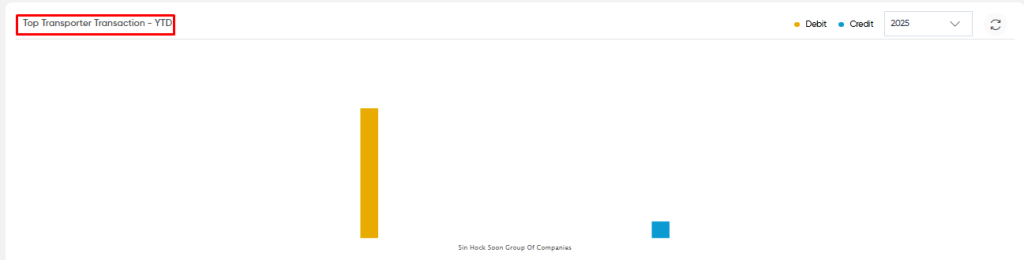
Top Transporter Transaction – YTD :
- Users can view the credit and debit fuel transactions with top transporters in a graphical representation for the year-to-date (YTD).
- This widget displays the quantity of fuel transactions, categorized by credit and debit, across the top transporters for a selected year.
- By choosing a specific year from the dropdown menu, users can filter the data to display transaction details relevant to that year.
- Hovering the cursor over the graph reveals detailed credit and debit quantities for each top transporter, allowing for in-depth analysis.
- A refresh icon is available to update the “Top Transporter Transaction – YTD” graph, ensuring users have access to the latest transaction data.