Dashboard Summary
Purpose
The Transport Management System (TMS) Dashboard serves as a centralized platform for overseeing and managing transportation and logistics operations. It provides users with an intuitive interface to monitor key aspects of their operations, offering real-time insights and updates to streamline workflows and enhance decision-making.
The dashboard is organized into various sections, including summaries of logistics, financial overviews, fuel depot management, and operational metrics. Each section delivers focused data and actionable insights, enabling users to track performance, manage resources, and address issues efficiently.
By offering a structured and detailed overview, the TMS Dashboard empowers users to stay informed and maintain control over their transportation processes. This comprehensive approach ensures efficient and effective management of logistics operations.
How To Navigate To Dashboard:
The navigation includes the following steps for viewing the “Dashboard” in the transporter management system.
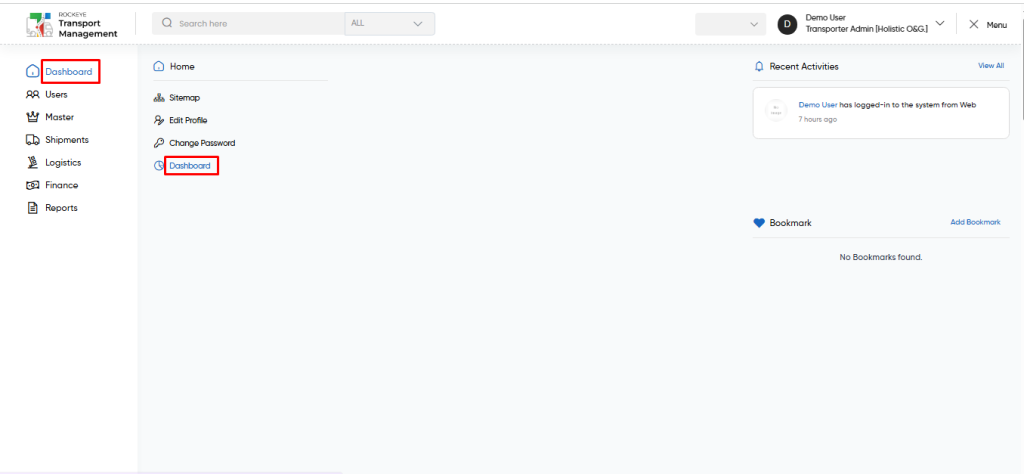
- Click on the Dashboard tab: The users can be accessed by clicking on the dashboard tab on the side menu.
- Click on Dashboard: The dashboard can be accessed by clicking it from the “dashboard section”.
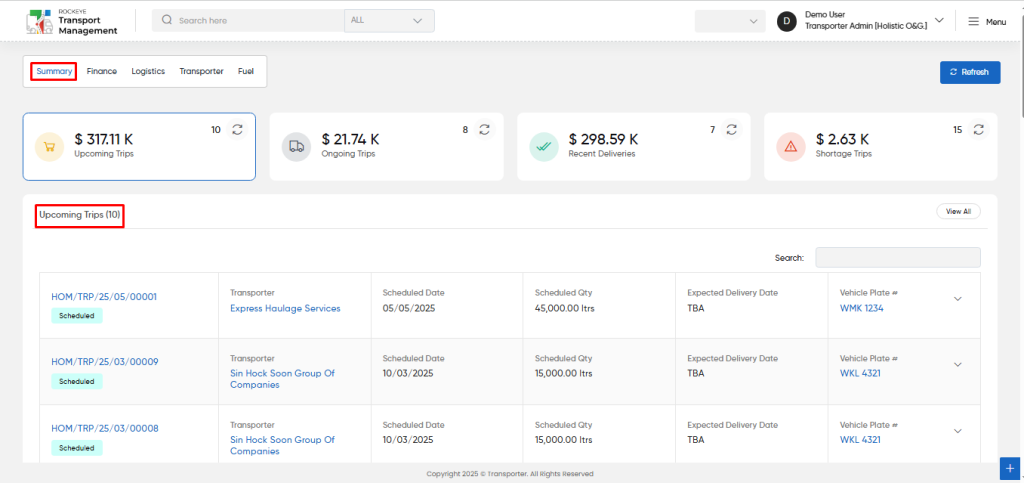
Summary
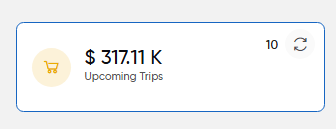
Upcoming Trips
The Upcoming trips widget in the summary section in the transport system represents the total value and the number (count) of the upcoming trips.
Upcoming trips provide a view of all scheduled trips that are yet to commence, enabling users to track vehicles on upcoming deliveries. Users can create new trips or add trips from orders directly within the module. Trips appear here once they are scheduled and remain listed until the vehicle starts loading. Key trip details like vehicle, driver, schedule date, and trip status can be accessed. The module also offers search, filter, and export functionalities for easy trip management and monitoring.
- Users will be able to use the refresh icon. When users click the refresh icon, the upcoming trip kpi will be updated.
- Users will be able to use the refresh icon which is at top right corner, the entire summary sections will be updated.
- Users will be able to view all upcoming trips by accessing the “view all” button.
- Users will be able to search the trip related data from the search box for the upcoming section.
- User will be able to view the upcoming trips data with the following
- Trip code with status
- Transporter Name
- Scheduled Date
- Scheduled Qty
- Expected Delivery Date
- Vehicle Plate
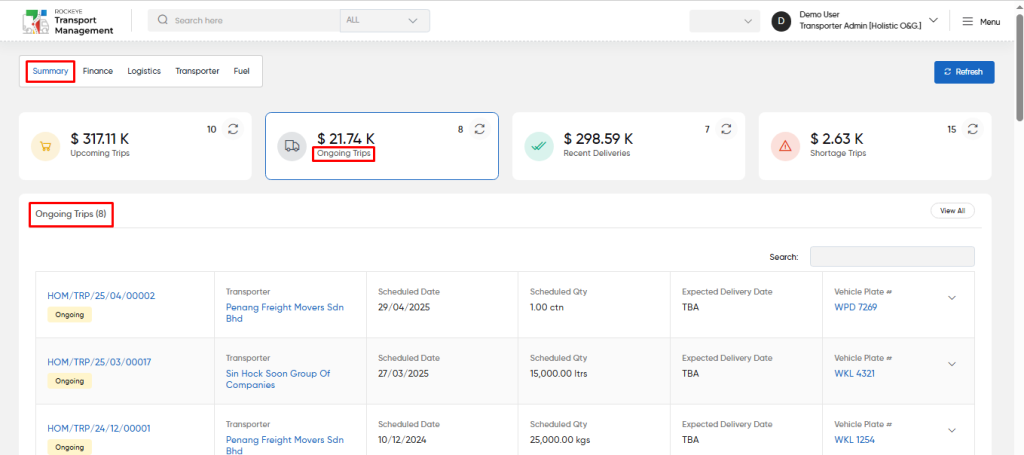
Ongoing Trips
The Ongoing trips widget in the summary section in the transport system represents the total value and the number (count) of the ongoing trips.
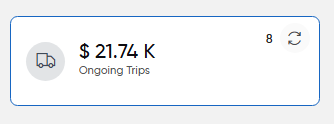
Ongoing trips provide a view of all scheduled trips that are in process, enabling users to track vehicles in ongoing trips.
- Users will be able to use the refresh icon. When users click the refresh icon, the ongoing trip kpi will be updated.
- Users will be able to use the refresh icon which is at top right corner, the entire summary sections will be updated.
- Users will be able to view all ongoing trips by accessing the “view all” button.
- Users will be able to search the trip related data from the search box for the ongoing section.
- User will be able to view the upcoming trips data with the following
- Trip code with status
- Transporter Name
- Scheduled Date
- Scheduled Qty
- Expected Delivery Date
- Vehicle Plate
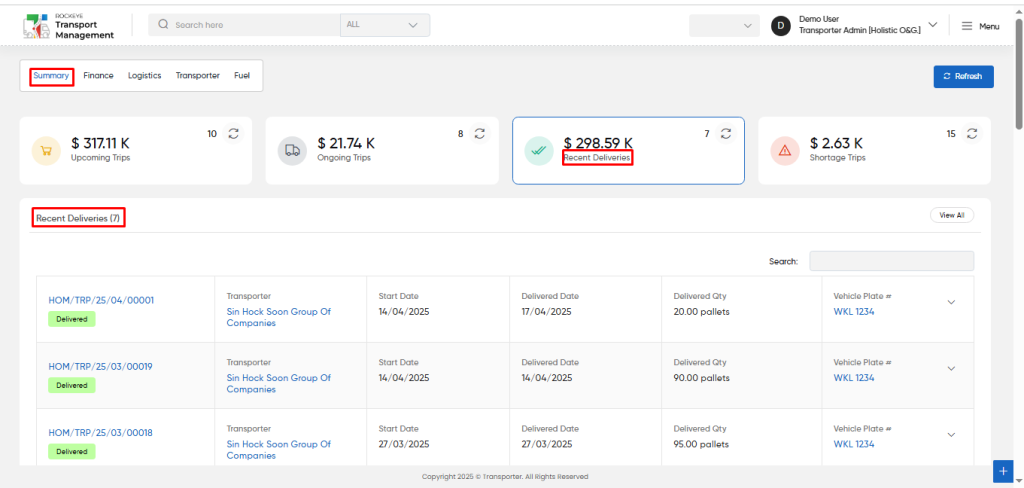
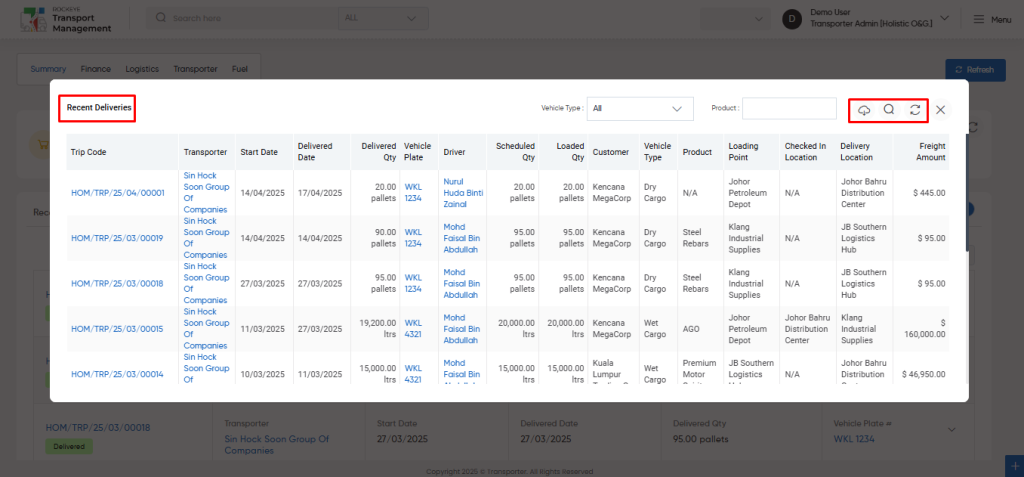
Recent Deliveries :
The Recent Deliveries widget in the summary section in the transport system represents the total value of the recent deliveries.
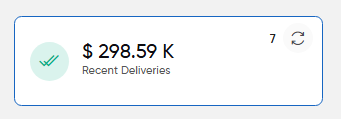
- Recent deliveries provide all the trips which are delivered recently.
- Users will be able to use the refresh icon. When users click the refresh icon, the “recent deliveries” kpi will be updated.
- Users will be able to use the refresh icon which is at top right corner, the entire summary sections will be updated.
- Users will be able to view all “recent deliveries” by accessing the “view all” button.
- Users will be able to search the trip related data from the search box for the “recent deliveries” section.
- User will be able to view the recent deliveries data with the following
- Trip code with status
- Transporter Name
- Start Date
- Delivered Date
- Delivered Qty
- Vehicle Plate
- Users will be able to view all the recent deliveries from the view all button as shown in below screen.
- Users can apply filters and search to find their desired “recent deliveries” from vehicle type and product fields.
- User will be able to export the “recent deliveries” data from the export icon
- Users can search and refresh for the “recent deliveries” page.
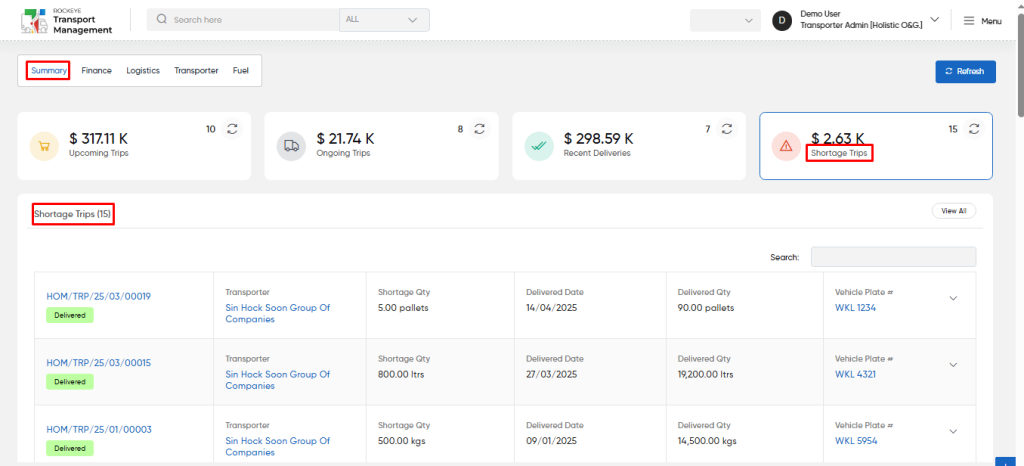
Shortage Trips :
The Shortage Trips widget in the summary section in the transport system represents the total value of the shortage trips.
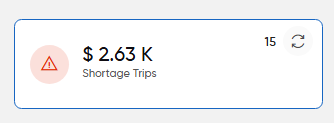
The “Trip – Shortage Delivery” is an essential that tracks and documents instances of delivery discrepancies during transport operations. When the quantity received is less than what was scheduled for a trip, this widget is automatically generated with the total value of those shortages.
- Users will be able to use the refresh icon. When users click the refresh icon, the “shortage trips” kpi will be updated.
- Users will be able to use the refresh icon which is at top right corner, the entire summary sections will be updated.
- Users will be able to view all “shortage trips” by accessing the “view all” button.
- Users will be able to search the shortage trip data from the search box.
- User will be able to view the shortage trips data with the following
- Trip code with status
- Transporter Name
- Shortage Qty
- Delivered Date
- Delivered Qty
- Vehicle Plate
- Driver
- Start Date
- Loaded Qty
- Customer
- Vehicle Type
- Product
- Loading Point
- Delivery Location
- Shortage Amount
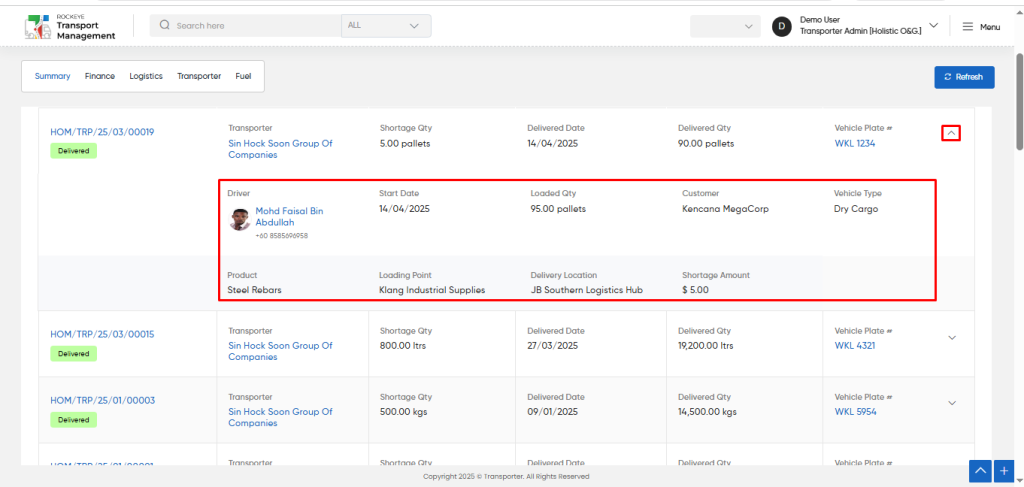
- Users will be able to view all the shortage trips from the view all button as shown in below screen.
- Users can apply filters and search to find their desired “shortage trips” from vehicle type and product fields.
- User will be able to export the “shortage trips” data from the export icon
- Users can search and refresh for the “shortage trips” page.
Transporters :
- Users will be able to view the number of transporters from this widget in the summary section.
- Users will be able to use the refresh icon. When users click the refresh icon, the “transporters” kpi will be updated.
- Users will be able to use the refresh icon which is at top right corner, the entire summary sections will be updated.
- Users will be able to access all the transporter information in popup page by clicking on the widget as follows :
- Company Name
- Company Classification
- Finas Entity Code
- Company Reg No
- Owner Name
- Owner Contact Number
- Type of Company
- Status
- Added Date
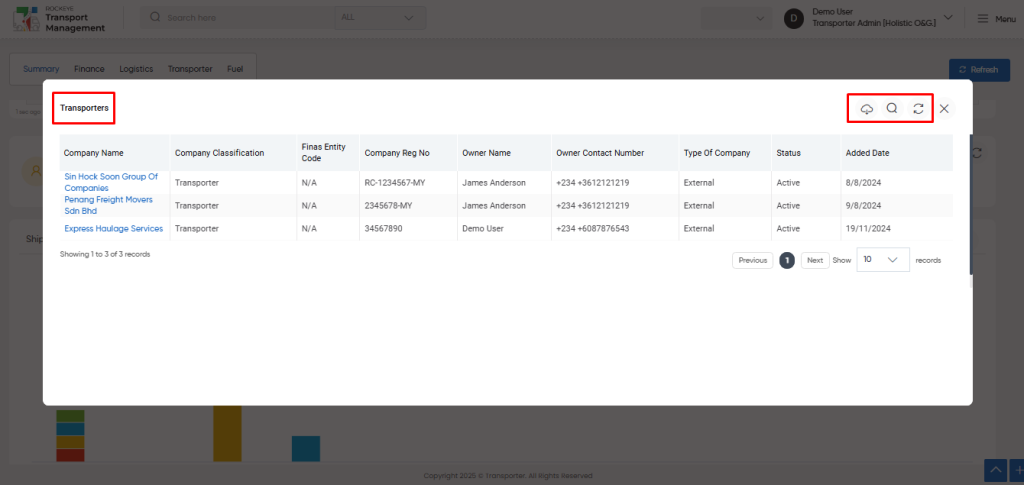
- Users will be able to search the transporters data from the search box.
- Users will be able to export the “transporters” data from the export icon.
- Users will be able to use the refresh icon. When users click the refresh icon, the “transporters” listing will be updated.
Vehicles :
- Users will be able to view the number of vehicles from this widget in the summary section.
- Users will be able to use the refresh icon. When users click the refresh icon, the “vehicles” kpi will be updated.
- Users will be able to use the refresh icon which is at top right corner, the entire summary sections will be updated.
- Users will be able to access all the vehicle information in popup page by clicking on the widget as follows :
- Vehicle Reg No
- Transporter
- Vehicle Type
- Capacity
- Vehicle Make
- Status
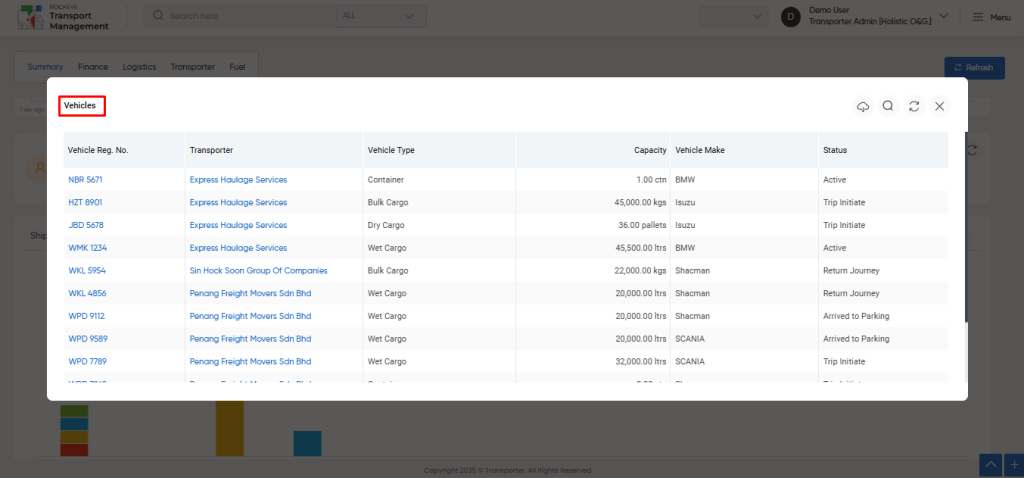
- Users will be able to search the vehicle’s data from the search box.
- Users will be able to export the “vehicles” data from the export icon.
- Users will be able to use the refresh icon. When users click the refresh icon, the “vehicles” listing will be updated.
Drivers :
- Users will be able to view the number of drivers from this widget in the summary section.
- Users will be able to use the refresh icon. When users click the refresh icon, the “drivers” kpi will be updated.
- Users will be able to use the refresh icon which is at top right corner, the entire summary sections will be updated.
- Users will be able to access all the driver information in popup page by clicking on the widget as follows :
- Driver
- Transporter Company
- Owner Contact Name
- License Number
- Gender
- Date of Birth
- State
- City
- Status
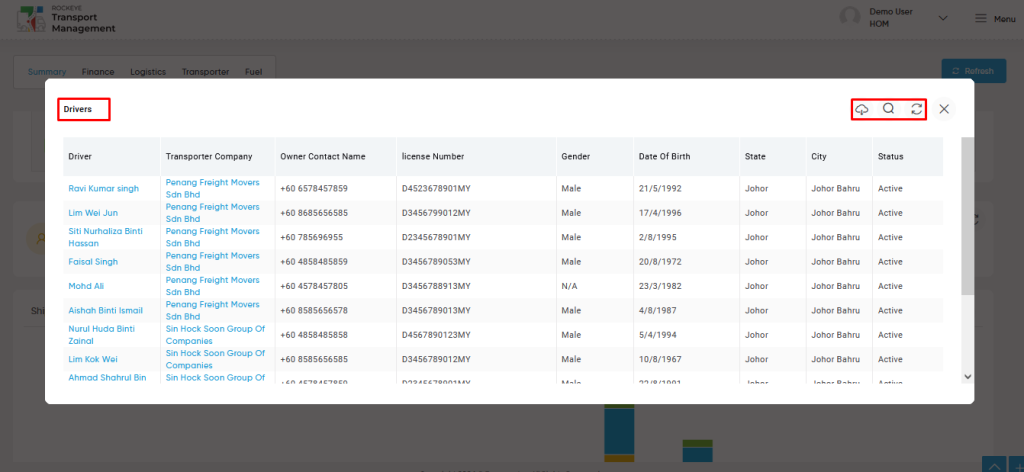
- Users will be able to search the driver’s data from the search box.
- Users will be able to export the “drivers” data from the export icon.
- Users will be able to use the refresh icon. When users click the refresh icon, the “drivers” listing will be updated.
Users :
- Users will be able to view the number of users from this widget in the summary section.
- Users will be able to use the refresh icon. When users click the refresh icon, the “users” kpi will be updated.
- Users will be able to use the refresh icon which is at top right corner, the entire summary sections will be updated.
- Users will be able to access all the user information in popup page by clicking on the widget as follows :
- Name
- Company
- Primary Role
- Status
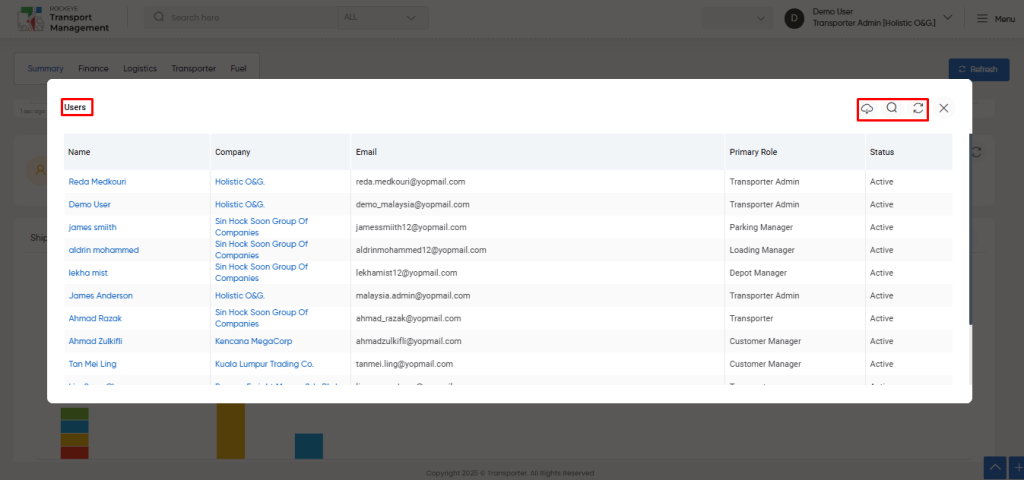
- Users will be able to search the user’s data from the search box.
- Users will be able to export the “users” data from the export icon.
- Users will be able to use the refresh icon. When users click the refresh icon, the “users” listing will be updated.
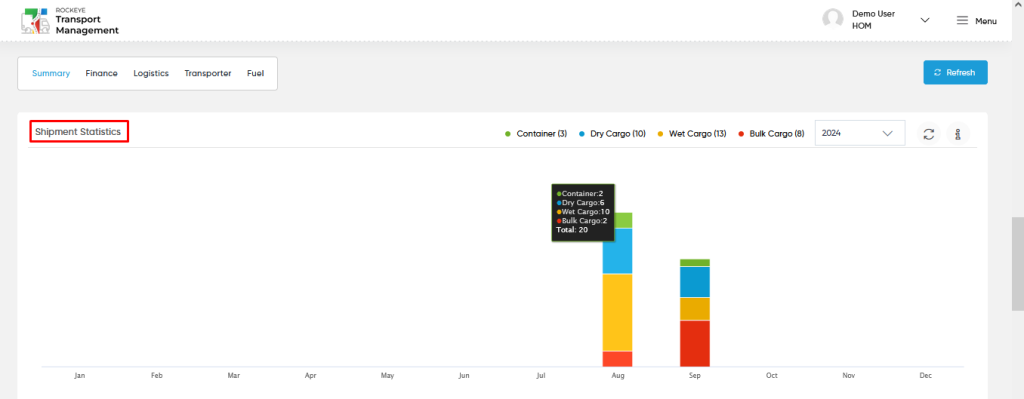
Shipment Statistics :
- Users can view a graphical representation of shipment statistics for various cargo types, displayed month by month for a selected year.
- By choosing a specific year from the dropdown, users can visualize shipment data categorized by cargo type for each month.
- The graph provides a clear overview of the total number of shipments for each cargo type throughout the year.
- Additionally, users can hover over an eye icon to see a title or brief explanation of the data.
- When hovering over a specific month’s graph, users can view the number of shipments for each cargo type during that month.
- A refresh icon is also available, allowing users to update the “shipment statistics” graph with the most recent data.
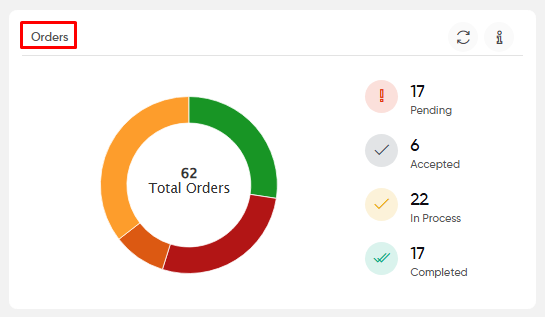
Orders :
- Users can view a graphical representation of orders categorized by various statuses, along with the corresponding order counts.
- The graph provides an overview of the total number of orders and their distribution across statuses such as pending, accepted, in process, and completed.
- The total order count for each status is clearly displayed.
- Additionally, users can hover over an eye icon for a title or brief explanation of the data.
- When hovering over a specific section of the graph, users can see the exact number of orders for each status.
- A refresh icon is provided to update the “orders” graph and counts with the latest available data.
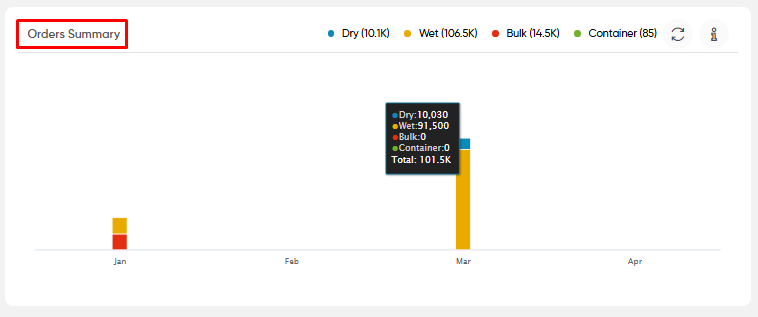
Orders Summary :
- Users can view a graphical representation of orders categorized by various cargo types, along with the corresponding order quantity values.
- The graph displays the total quantities of orders for different cargo types on a month-by-month basis, including categories such as dry, wet, bulk, and container cargo.
- Users can also see the overall ordered quantity for all cargo types combined.
- By hovering over an eye icon, users can access a title or brief explanation of the displayed data.
- Hovering over a specific month’s graph reveals the quantity of orders for each cargo type during that month.
- A refresh icon is available, allowing users to update the “orders summary” graph with the most current data.
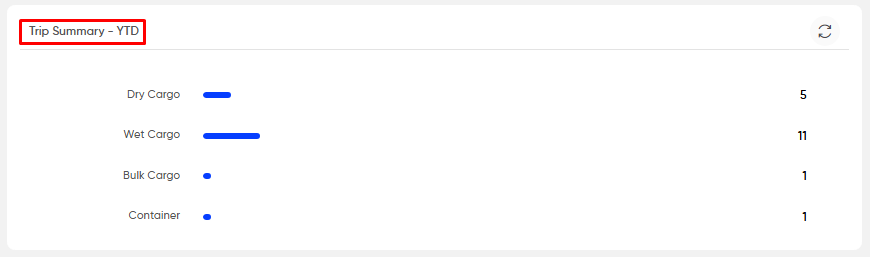
Trip Summary – YTD:
- Users can view a graphical representation of the year-to-date (YTD) trip summary, showcasing the count of completed trips categorized by cargo type.
- The graph displays how many trips have been completed for each cargo type throughout the year.
- By hovering over a specific cargo type in the graph, users can see the exact count of completed trips for that particular cargo type in the YTD period.
- By hovering over an eye icon, users can access a title or brief explanation of the displayed data.
- A refresh icon is available to update the “Trip Summary – YTD” graph with the most current data, ensuring users have access to the latest trip completion information.
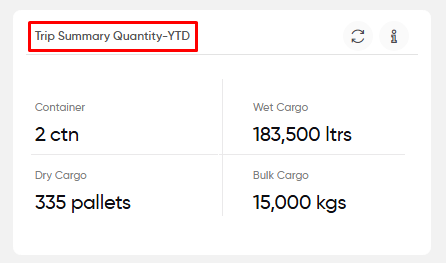
Trip Summary Quantity – YTD:
- Users can view a statistical representation of the year-to-date (YTD) trip summary, highlighting the quantity of goods delivered in completed trips, categorized by cargo type.
- The widget provides a clear overview of the total quantities delivered for each cargo type throughout the year.
- A refresh icon is available to update the “Trip Summary Quantity – YTD” graph with the most current data, ensuring users can access the latest information on delivered quantities.
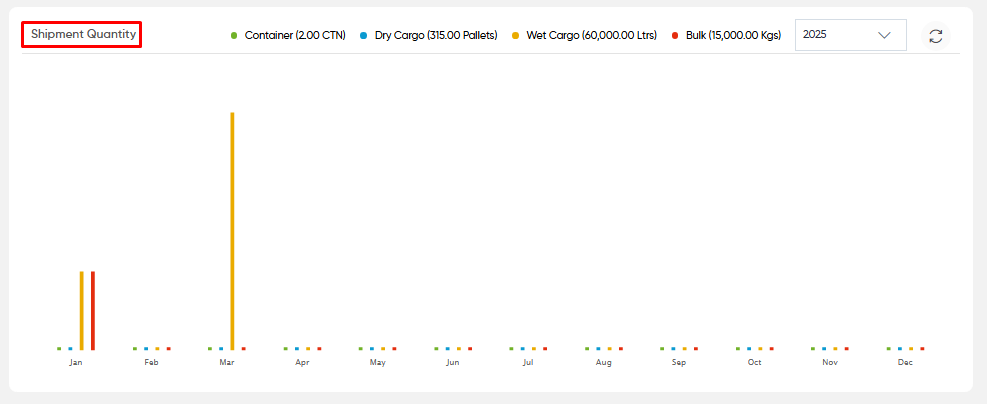
Shipment Quantity :
- Users can view a graphical representation of shipment quantity for various cargo types, displayed month by month for a selected year.
- By choosing a specific year from the dropdown, users can visualize shipment quantity data categorized by cargo type for each month.
- The graph provides a clear overview of the total quantity of shipments for each cargo type throughout the year.
- When hovering over a specific month’s graph, users can view the number of shipments for each cargo type during that month.
- A refresh icon is also available, allowing users to update the “shipment quantity” graph with the most recent data.