Transport Management
Dashboard – Finance
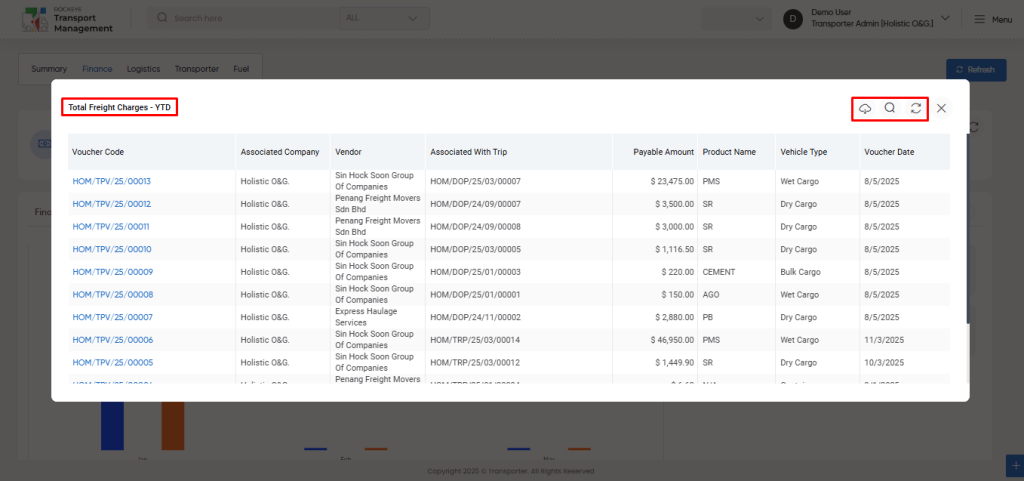
Total Freight Charges – YTD :
- Users can view a statistical overview of the total freight charges for all completed trips in the year-to-date (YTD) period. This widget, accessible from the finance section, provides insight into the overall payable freight charges associated with each trip.
- A refresh icon allows users to update the “Total Freight Charges – YTD” graph, ensuring access to the most up-to-date financial data.
- User will be able to view the total freight charges- YTD data with the following
- Voucher Code
- Associated Company
- Vendor
- Associated with trip
- Payable amount
- Product name
- Vehicle type
- Voucher date
- Users can click on the widget to view all freight rate details and export the data in CSV or PDF format using the export icon.
- A search and refresh function is available for easy access to specific freight rate information.
In – Transit Freight Charges – YTD :
- Users can view a statistical overview of the freight charges for trips that are currently in progress, referred to as “In-Transit Freight Charges.”
- This widget, accessible from the finance section, provides insight into the estimated freight charges for trips that have not yet been completed.
- A refresh icon allows users to update the “In-Transit Freight Charges” graph, ensuring access to the most current financial data for trips still in progress.
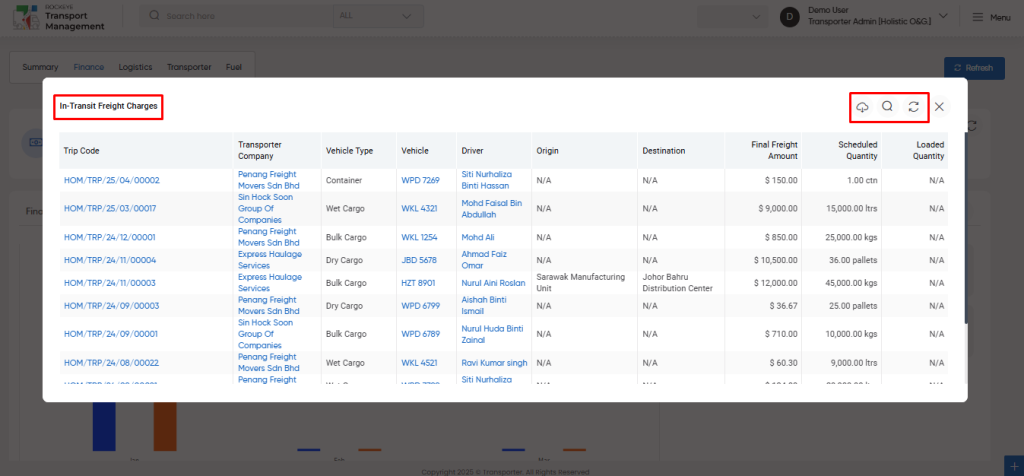
- User will be able to view the In – Transit Freight Charges data with the following
- Trip Code
- Transporter Company
- Vehicle type
- Vehicle
- Driver
- Origin
- Destination
- Final Freight amount
- Scheduled quantity
- Loaded quantity
- Users can click on the widget to view all “In-Transit freight rate” details and export the data in CSV or PDF format using the export icon.
- A search and refresh function is available for easy access to specific “In-Transit freight rate” information.
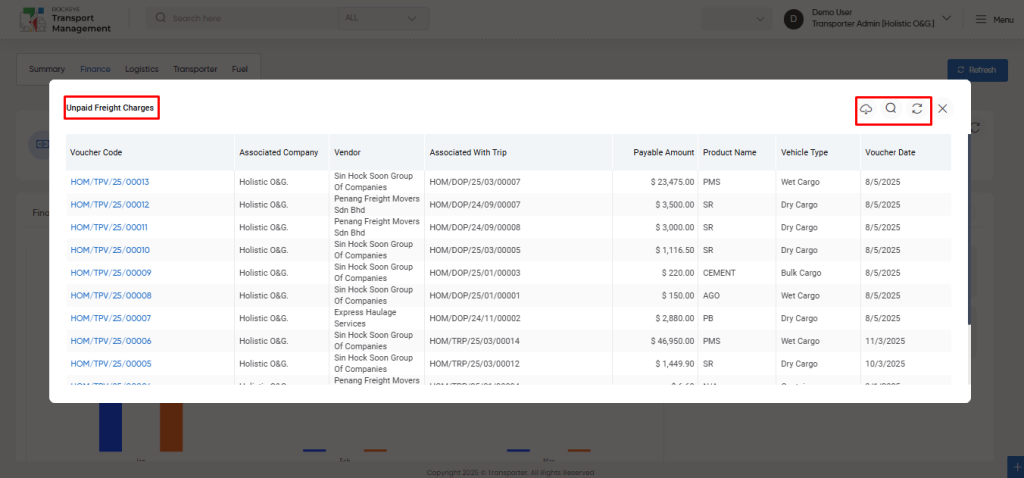
Unpaid Freight Charges :
- Users can view a statistical overview of unpaid freight charges associated with completed trips.
- This widget, accessible from the finance section, provides insight into the total amounts that remain unpaid.
- A refresh icon allows users to update the “Unpaid Freight Charges” data, ensuring access to the most current financial information regarding outstanding payments.

- User will be able to view the unpaid Freight Charges data with the following
- Voucher Code
- Associated Company
- Vendor
- Associated with Trip
- Payable Amount
- Product Name
- Vehicle Type
- Voucher Date
- Users can click on the widget to view all “unpaid freight rate” details and export the data in CSV or PDF format using the export icon.
- A search and refresh function is available for easy access to specific “unpaid freight rate” information.
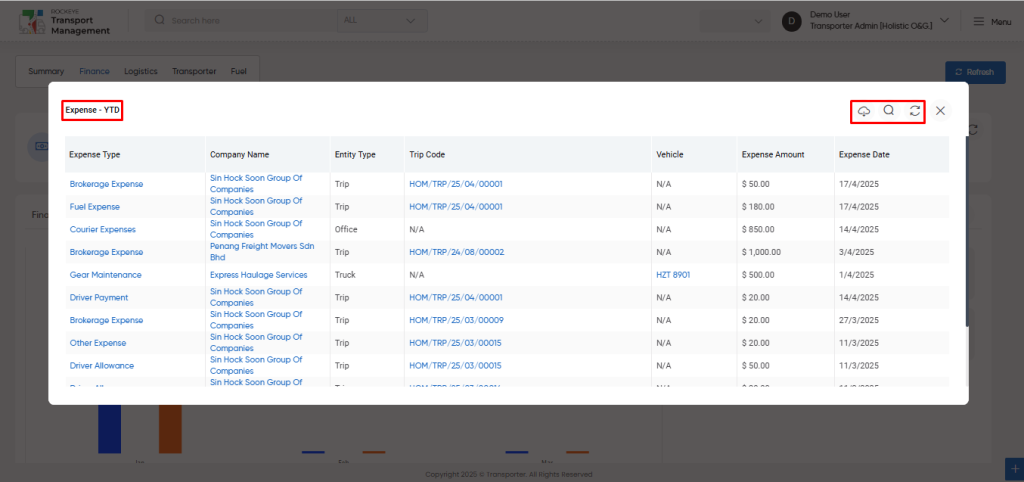
Expense – YTD :
- Users can view a statistical overview of all expenses incurred year-to-date (YTD). This widget, accessible from the finance section, provides insight into the total expenses associated with various trips and operations.
- A refresh icon allows users to update the “Expenses – YTD” data, ensuring access to the most current financial information.
- User will be able to view the expense – ytd data with the following
- Expense Type
- Company Name
- Entity Type
- Trip Code
- Vehicle
- Expense Amount
- Expense Date
- Users can click on the widget to view all “Expense – YTD” details and export the data in CSV or PDF format using the export icon.
- A search and refresh function is available for easy access to specific “Expense – YTD” information.
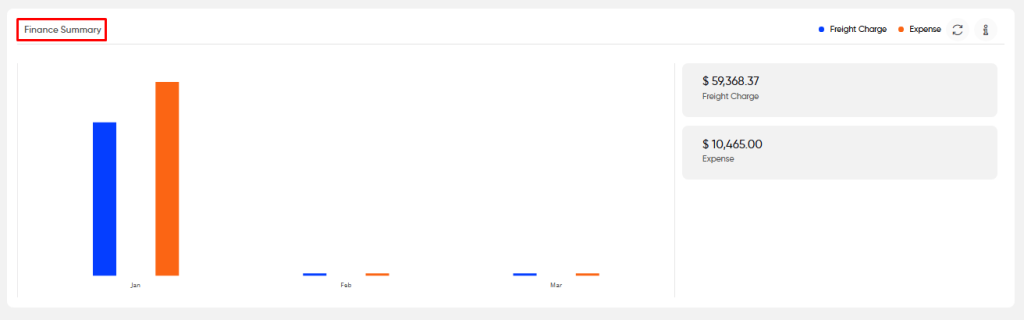
Finance Summary:
- Users can view a graphical overview of the complete financial summary, including freight charges and expenses incurred year-to-date (YTD).
- This widget provides a month-wise breakdown of total freight charges and expenses, offering insight into the organization’s financial performance.
- By hovering over an eye icon, users can access a title or brief explanation of the displayed data.
- Additionally, hovering the cursor over the graph reveals specific values for each month, allowing for a more detailed analysis.
- Users can view the total financial summary of the freight charge and the expenses till current date.
- A refresh icon is available to update the “Finance Summary” graph, ensuring users have access to the most recent financial data.
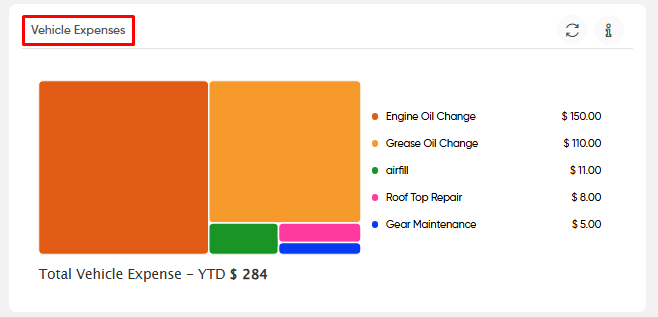
Vehicle Expenses :
- Users can view a graphical representation of various vehicle expenses incurred by transporters.
- This widget provides insights into total expense values categorized by types, such as grease, oil, tyre punctures, minor repairs, and more.
- Users can also see the overall total vehicle expenses year-to-date (YTD).
- By hovering over an eye icon, users can access a title or brief explanation of the displayed data.
- Additionally, hovering the cursor over the graph reveals specific values for each vehicle expense type, facilitating a more detailed analysis.
- A refresh icon is available to update the “Vehicle Expenses” graph, ensuring users have access to the most current financial data.
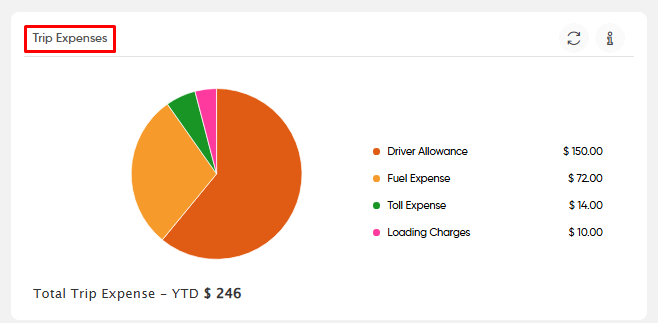
Trip Expenses :
- Users can view a graphical representation of various trip expenses incurred by transporters.
- This widget provides insights into total expense values categorized by types, such as fuel expenses, driver payment, loading charges, and more.
- Users can also see the overall total trip expenses year-to-date (YTD).
- By hovering over an eye icon, users can access a title or brief explanation of the displayed data.
- Additionally, hovering the cursor over the graph reveals specific values for each trip expense type, facilitating a more detailed analysis.
- A refresh icon is available to update the “Trip Expenses” graph, ensuring users have access to the most current financial data.
Office Expenses :
- Users can view a graphical representation of various office expenses incurred by transporters.
- This widget provides insights into total expense values categorized by types, such as stationary expenses, electricity, labour, and more.
- Users can also see the overall total office expenses year-to-date (YTD).
- By hovering over an eye icon, users can access a title or brief explanation of the displayed data.
- Additionally, hovering the cursor over the graph reveals specific values for each office expense type, facilitating a more detailed analysis.
- A refresh icon is available to update the “Office Expenses” graph, ensuring users have access to the most current financial data.

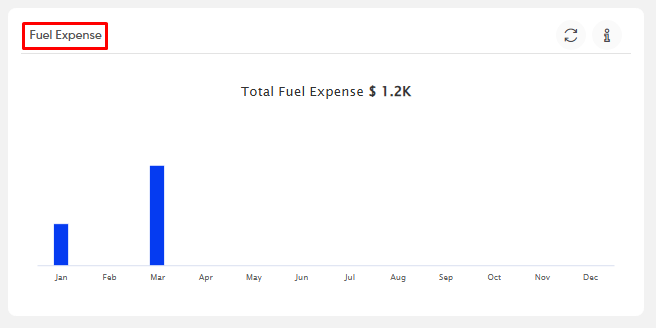
Fuel Expenses :
- Users can view a graphical representation of various fuel expenses incurred by transporters.
- This widget provides insights into total fuel expense categorized by month wise.
- Users can also see the overall total fuel expenses year-to-date (YTD).
- By hovering over an eye icon, users can access a title or brief explanation of the displayed data.
- Additionally, hovering the cursor over the graph reveals specific values for each fuel expense within a specific month, facilitating a more detailed analysis.
- A refresh icon is available to update the “Fuel Expenses” graph, ensuring users have access to the most current financial data.
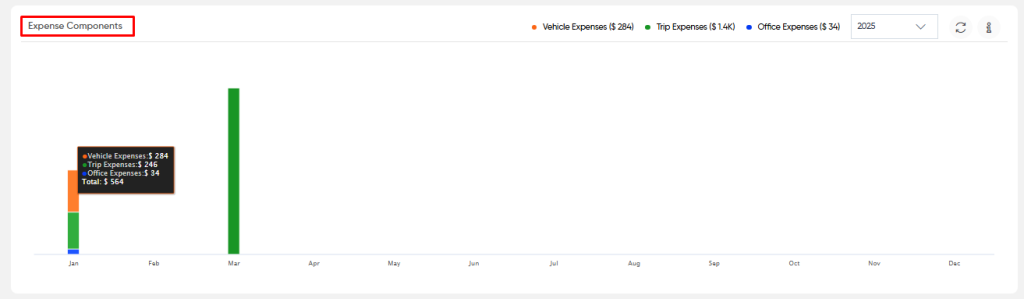
Expense Components:
- Users can view a graphical representation of various expense components incurred by transporters.
- This widget provides insights into month-wise expense categories, including vehicle expenses, trip expenses, and office expenses.
- Users can also see the overall total expense components categorized by vehicle, trip, and office for the year-to-date (YTD).
- By selecting a specific year from the dropdown menu, users can visualize expense component data for each month, categorized by expense type.
- Hovering over an eye icon allows users to access a title or brief explanation of the displayed data.
- Additionally, hovering the cursor over the graph reveals specific values for each expense category within a specific month, facilitating a more detailed analysis.
- A refresh icon is available to update the “Expense Components” graph, ensuring users have access to the most current financial data.
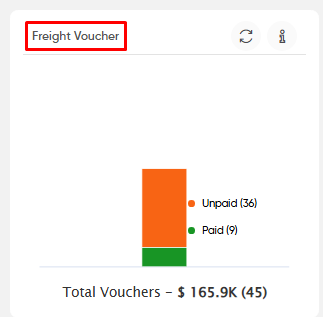
Freight Voucher :
- Users can view a graphical representation of the payment status (paid/unpaid) of freight vouchers.
- This widget provides insights into the overall total value and the count of vouchers.
- By hovering over an eye icon, users can access a title or brief explanation of the displayed data.
- Additionally, hovering the cursor over the graph reveals specific values for both unpaid and paid freight vouchers, enabling a more detailed analysis.
- A refresh icon is available to update the “Freight Vouchers” graph, ensuring users have access to the most current financial data.
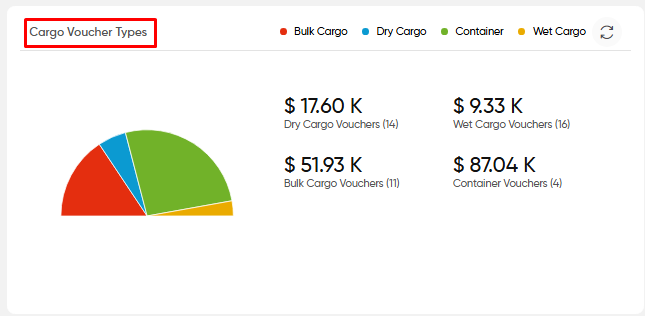
Cargo Voucher Types :
- Users can view a graphical representation of the monetary value of various cargo voucher types.
- This widget provides insights into the values associated with vouchers for specific cargo types used in trips.
- By hovering the cursor over the graph, users can see specific values for the amount related to each cargo type.
- A refresh icon is also available to update the “Cargo Voucher Types” graph, ensuring users have access to the most current financial data.
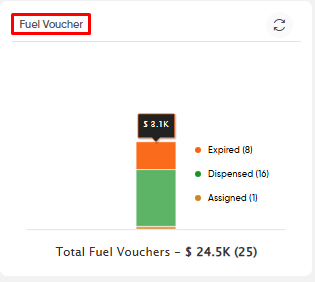
Fuel Voucher :
- Users can view a graphical representation of the voucher status (Dispensed / Expired ) of fuel vouchers.
- This widget provides insights into the overall total value and the count of fuel vouchers.
- By hovering the cursor over the graph reveals specific values for both dispensed and expired fuel vouchers, enabling a more detailed analysis.
- A refresh icon is available to update the “Fuel Vouchers” graph, ensuring users have access to the most current financial data.
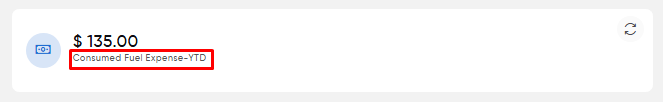
Consumed Fuel Expense – YTD:
- Users can view the statistical value of the total consumed fuel expenses for the year-to-date (YTD).
- This widget provides insights into the overall expenditure on fuel consumption, allowing users to track fuel expenses effectively throughout the year.
- A refresh icon is available to update the “Consumed Fuel Expense – YTD” graph, ensuring users have access to the most current financial data.
Completed Trips – YTD & Delivered Product Price – YTD:
- Users can view the statistical count of completed trips year-to-date (YTD) alongside the total value of delivered product prices during the same period.\
- This widget provides a comprehensive overview of both the number of trips completed and the associated revenue from delivered products.
- A refresh icon is available to update the “Completed Trips – YTD & Delivered Product Price – YTD” graph, ensuring users have access to the most current financial data.

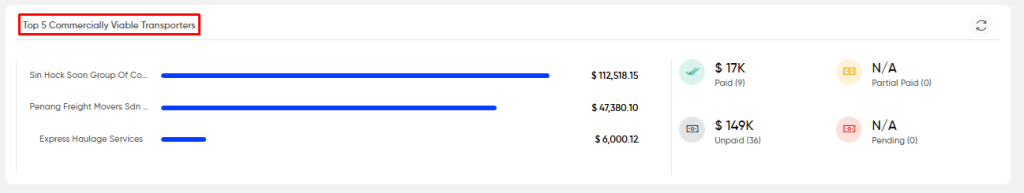
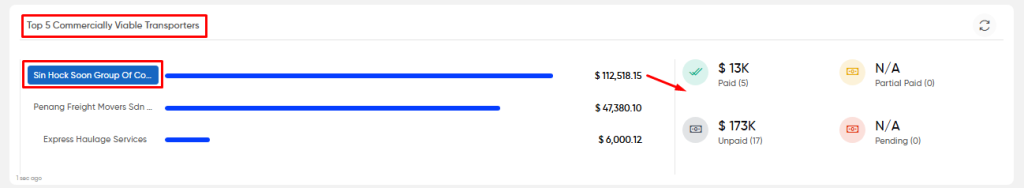
Top 5 commercially viable transporters :
- Users can view the statistical value associated with the top five commercially viable transporters.
- This widget provides insights into the overall financial contributions of these transporters, as well as their payment statuses, including paid, unpaid, partially paid, and pending for their trips.
- Users can click on a specific transporter to access detailed information regarding their payment status.
- A refresh icon is available to update the “Top 5 Commercially Viable Transporters” graph, ensuring users have access to the most current financial data.