Transporter
Transporters:

- Users will be able to view the number of transporters from this widget in the transporter section.
- Users will be able to use the refresh icon. When users click the refresh icon, the “transporters” kpi will be updated.
- Users will be able to use the refresh icon which is at top right corner, the entire transporter sections will be updated.
Drivers :
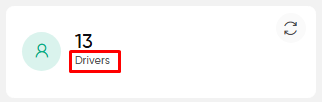
- Users will be able to view the number of drivers from this widget in the transporter section.
- Users will be able to use the refresh icon. When users click the refresh icon, the “drivers” kpi will be updated.
- Users will be able to use the refresh icon which is at top right corner, the entire transporter sections will be updated.
Total Orders :
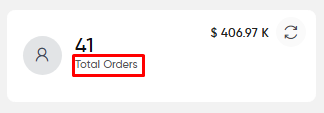
- Users will be able to view the total number of orders and value of the orders from this widget in the transporter section.
- Users will be able to use the refresh icon. When users click the refresh icon, the “total orders” kpi will be updated.
- Users will be able to use the refresh icon which is at top right corner, the entire transporter sections will be updated.
Unpaid Dues:
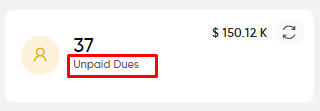
- Users will be able to view the total number of unpaid dues and value of the unpaid dues from this widget in the transporter section.
- Users will be able to use the refresh icon. When users click the refresh icon, the “unpaid dues” kpi will be updated.
- Users will be able to use the refresh icon which is at top right corner, the entire transporter sections will be updated.
Top Transporters :
- Users can view the statistical value associated with the top transporters.
- This widget provides insights into the overall financial contributions of these transporters, as well as their payment statuses, including paid, unpaid, partially paid, and pending for their trips.
- Users can click on a specific transporter to access detailed information regarding their payment status.
- A refresh icon is available to update the "Top Transporters" graph, ensuring users have access to the most current financial data.

Revenue Generation :
- Users will be able to view the revenue generation of the transporters through a graphical representation.
- This widget displays the revenue generated by different cargo types, along with their corresponding statistical values.
- By hovering over the graph, users can access specific details about the revenue generated for each cargo type.
- A refresh icon is available to update the "Revenue Generation" graph, ensuring users have access to the most current financial data.

Recent Short Deliveries :
- Users will be able to view transporter-wise quantities for various statuses, including scheduled quantity, delivered quantity, dispatched quantity, and shortage quantity.
- This widget presents the shortage quantity value in both graphical and statistical formats, allowing for easy comparison among transporters.
- Users can apply a search filter to select specific cargo from a dropdown menu and check the statistical quantity values across different statuses while also viewing shortage deliveries.
- By hovering over the graph, users can access specific details about the quantity for each transporter.
- A refresh icon is available to update the "Recent Short Deliveries" graph, ensuring users have access to the most current data.

Expense Components :
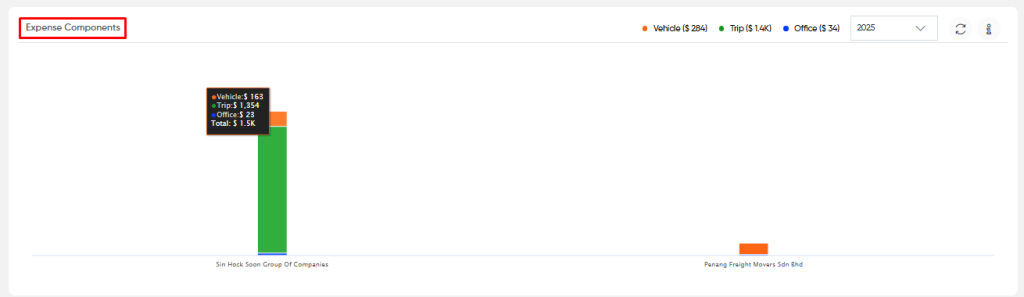
- Users can view a graphical representation of various expense components incurred by transporters.
- This widget provides insights into different expense categories, including vehicle expenses, trip expenses, and office expenses, with data filtered by transporter.
- Users can also see the overall total expense components categorized by vehicle, trip, and office for the year-to-date (YTD).
- By selecting a specific year from the dropdown menu, users can access and visualize expense component data for the selected year, categorized by expense type and associated with transporters (rather than month-wise).
- Hovering over an eye icon allows users to access a title or brief explanation of the displayed data.
- Additionally, hovering the cursor over the graph reveals specific values for each expense category related to the selected transporter, facilitating a more detailed analysis.
- A refresh icon is available to update the "Expense Components" graph, ensuring users have access to the most current financial data.
Fuel Expense :
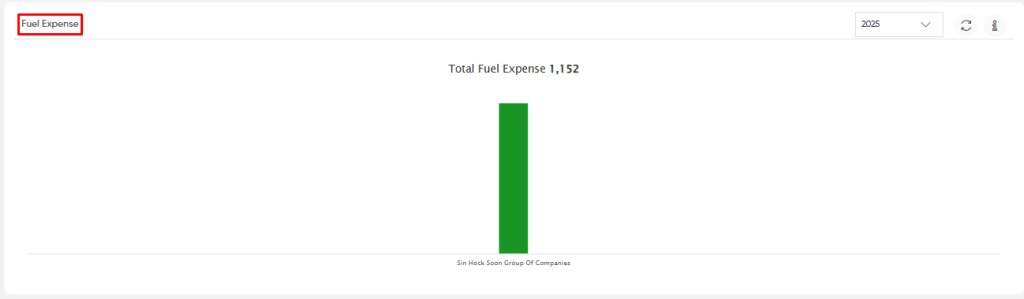
- Users can view the fuel expenses by transporter in a graphical representation.
- This widget also shows the total value of fuel expenses for all transporters, providing a clear financial overview.
- By selecting a specific year from the dropdown menu, users can visualize fuel expense data for each month, categorized by transporter.
- By hovering over an eye icon, users can access a brief explanation of the displayed data.
- Additionally, hovering over the graph reveals specific values for each transporter's fuel expenses, enabling detailed analysis.
- A refresh icon is available to update the "Fuel Expense" graph, ensuring users have the most current financial data at their disposal.