Dashboard
Introduction/Purpose
A dashboard in smart stations offers a centralized interface for real-time monitoring and control. It consolidates data on energy, environment, security, equipment, passenger flow, service status, and finances. This visual representation empowers stakeholders to make informed decisions, optimize operations, and enhance efficiency, safety, and service quality.
How to Navigate:
The navigation to record dashboard in smart station typically involves the following steps:
- Click on the Home tab, which is located at the left side of the screen, and then click on the Dashboard section. After clicking on this link, User can navigate to the dashboard page.
Recording:
When a user clicks on the dashboard section the user will be redirected to the below page.
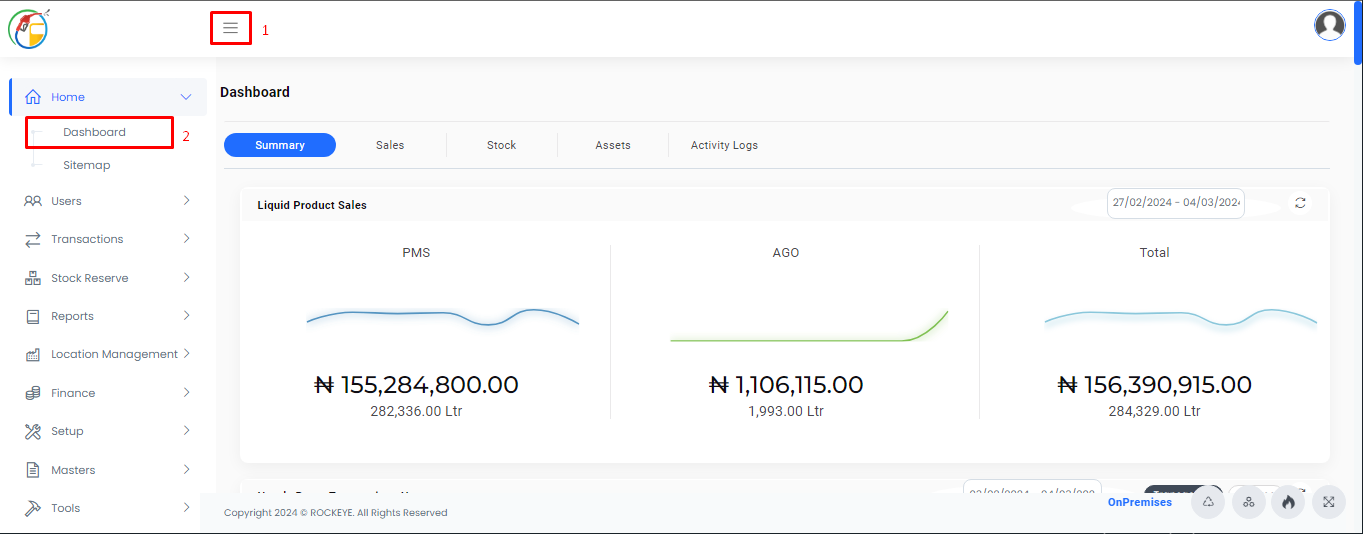
Overall Summary:
The overview summary tab provides a comprehensive KPIs of s and insights crucial
for effective management of the smart station. It includes various section such as:
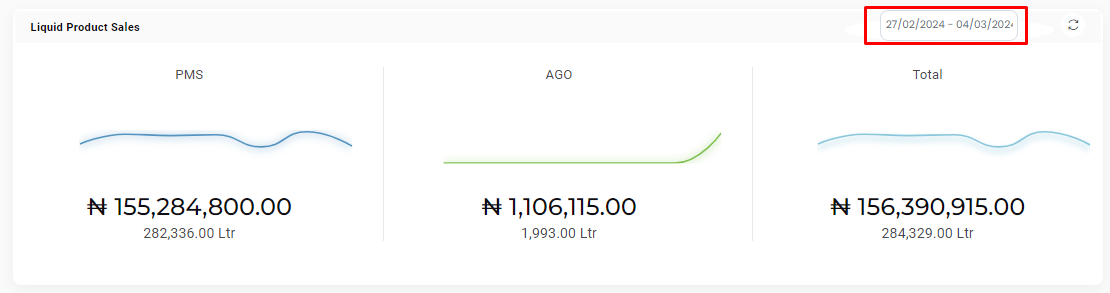
- Liquid Product Sales: Displays a summary of sales data for liquid products, allowing stakeholders to track revenue trends and analyze sales performance over time.
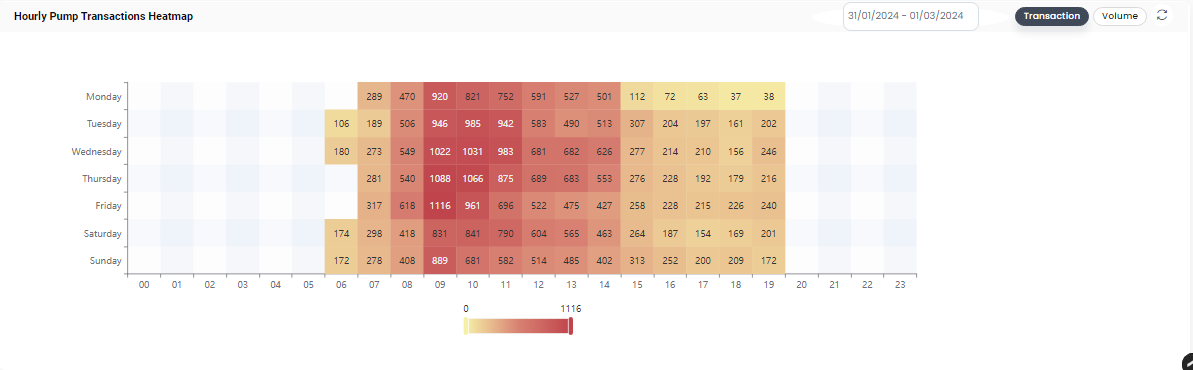
- Hourly Pump Transactions Heatmap: Visualizes pump transaction data throughout the day, providing insights into peak usage hours and optimizing staffing and resources accordingly.
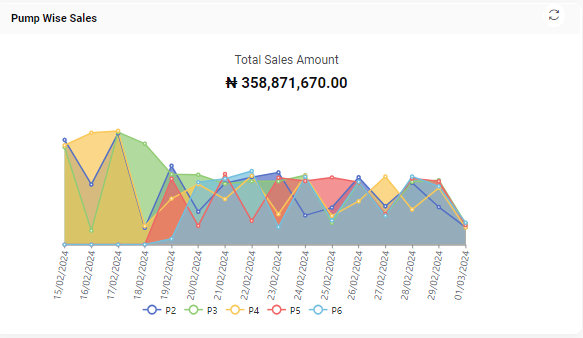
- Pump Wise Sales: Breaks down sales figures by individual pumps, enabling operators to identify high-performing pumps and optimize their placement and maintenance strategies.
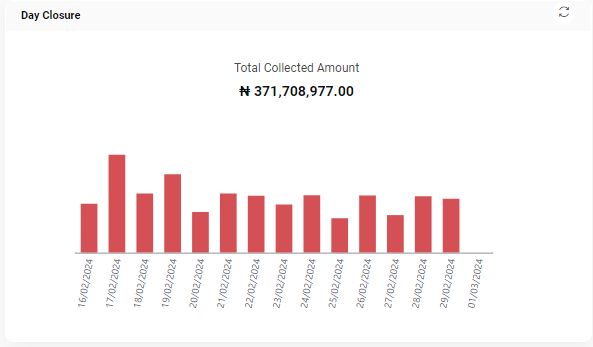
- Day Closure: Offers a quick overview of station activities and financials at the end of each day, facilitating efficient accounting and reconciliation processes.
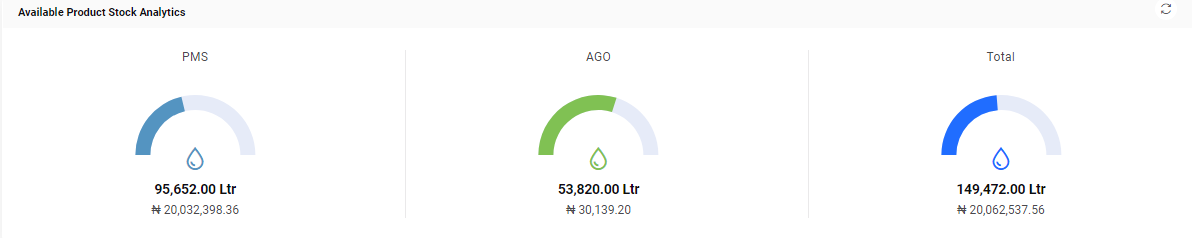
- Available Product Stock Analytics: Provides analytics on available product stock, ensuring timely replenishment and preventing stockouts.
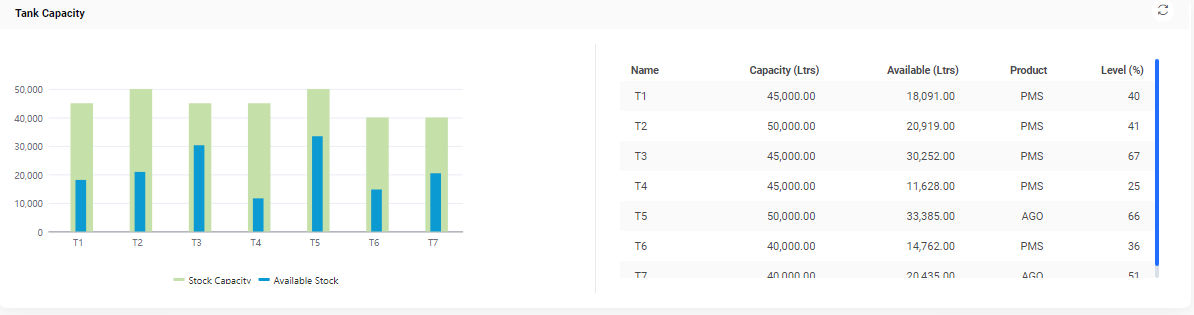
- Tank Capacity: Monitors the capacity of storage tanks for various products, helping operators manage inventory levels and avoid overfilling or shortages.
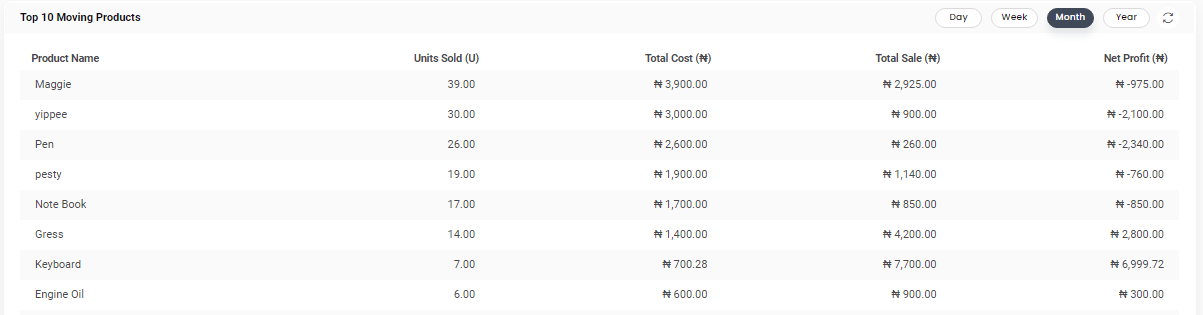
- Top 10 Moving Products: Highlights the top-selling products, guiding inventory management and marketing efforts to capitalize on popular items.
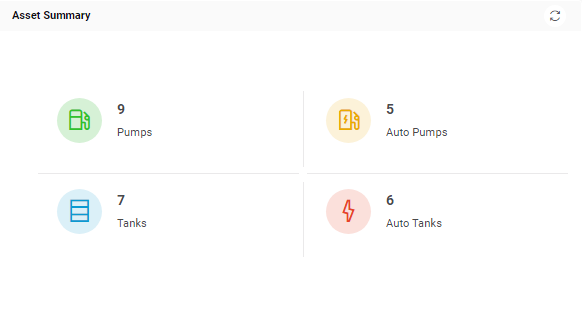
- Asset Summary: Summarizes the status and performance of station assets, aiding in maintenance planning and budget allocation.
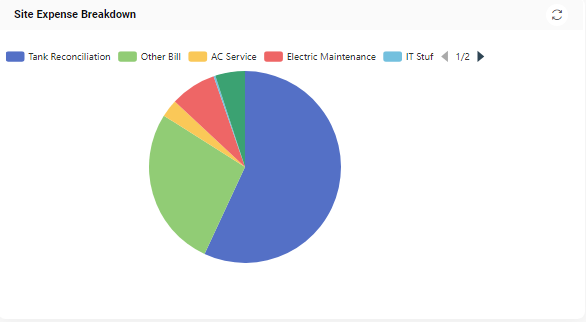
- Site Expense Breakdown: Breaks down station expenses by category, facilitating cost analysis and budget optimization.
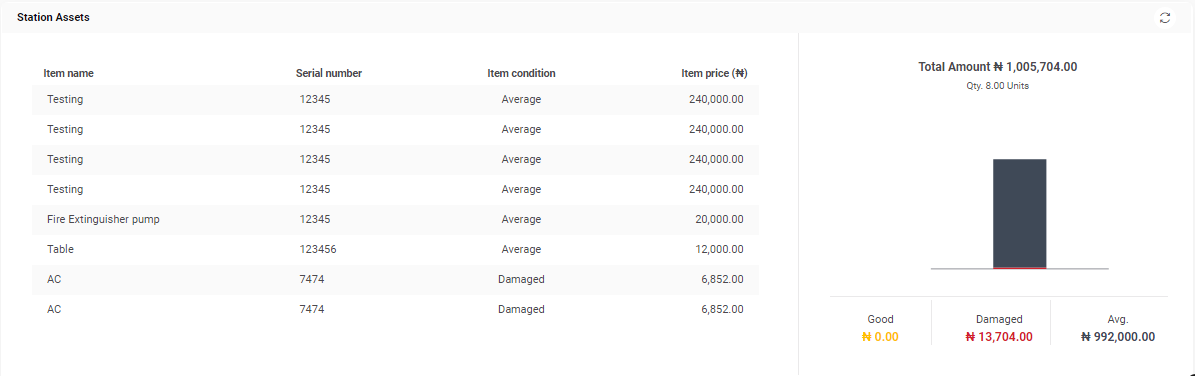
- Station Assets: Provides an overview of all station assets, including equipment and infrastructure, to ensure proper maintenance and upkeep.
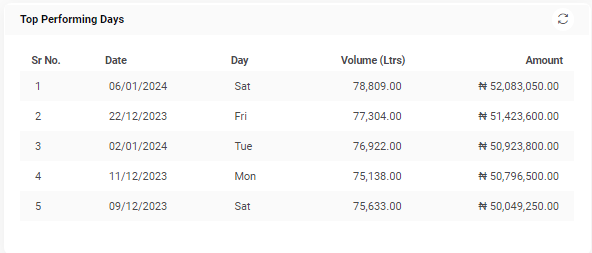
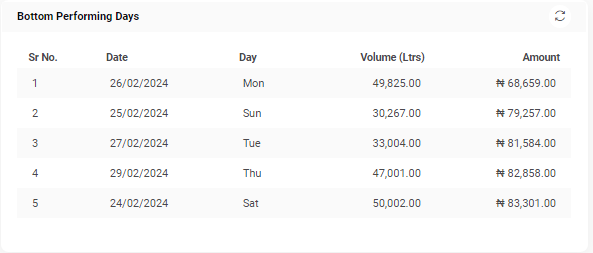
- Top Performing Days and Bottom Performing Days: Identifies days with the highest and lowest sales or operational performance, allowing stakeholders to analyze trends and make data-driven decisions for improvement.
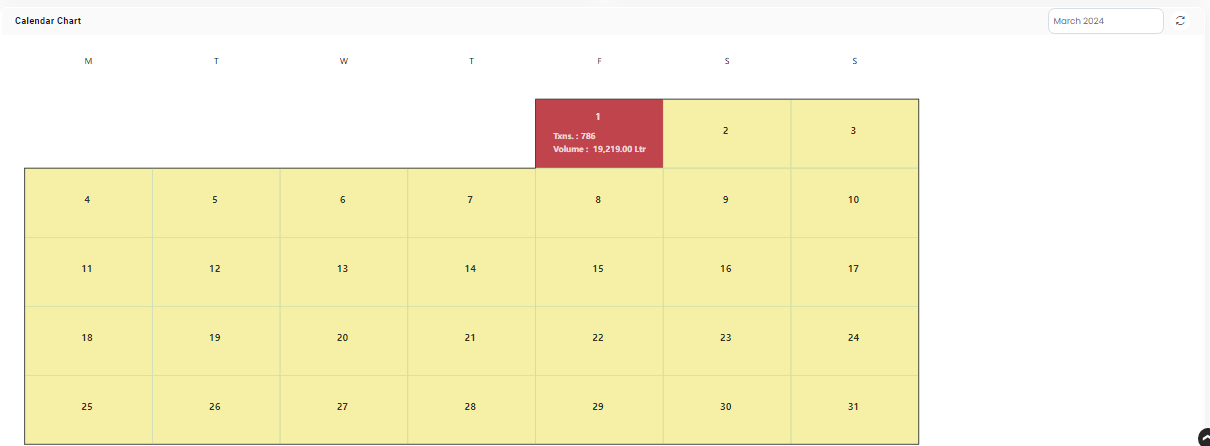
- Calendar Chart: Offers a visual representation of station activities, events, and performance metrics over time, aiding in trend analysis and planning.
Overall, the Overview Summary tab serves as a central hub for accessing critical information and insights, enabling stakeholders to monitor station performance, optimize operations, and make informed decisions to enhance efficiency and profitability.