General/Overall Summary
Introduction/Purpose
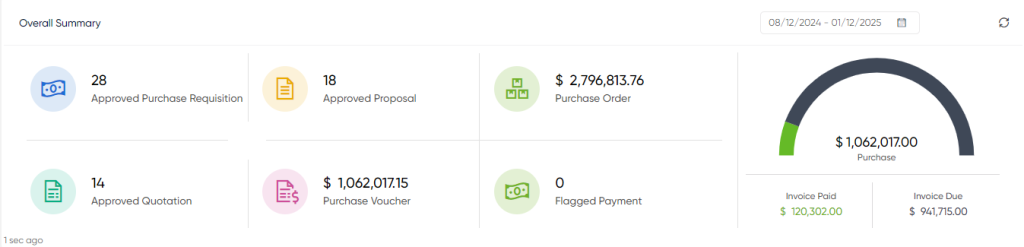
The Overall Summary dashboard element in the procurement system provides a concise overview of important metrics.
- It includes counts of approved purchase requests (PR), proposals, and quotations within a specified date range.
- The dashboard also displays the total amount spent on purchase orders (PO) and purchase vouchers (PV).
- A gauge chart visually represents the amount of paid and due invoices.
- Users can filter the data by selecting a specific date range.
- Clickable actions are available for each metric, allowing users to access supporting list of records.
- Supporting List of records can be downloaded in PDF and CSV formats and Option to Email.
General/Top Five Department Request
Introduction/Purpose
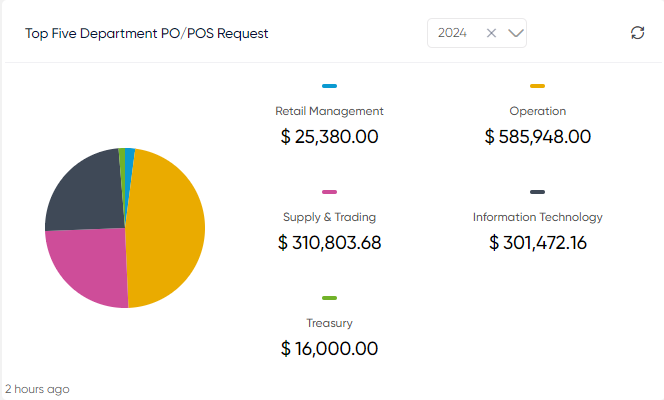
The widget provides a visual representation of the distribution of procurement activities among the top 5 departments.
- The "Top Five Departments Requests" widget in the procurement system dashboard shows a pie chart.
- It displays the top 5 departments for which purchase requisition were generated in a financial year.
- The widget allows filtering of the report based on different financial years.
- It summarizes the data by showing the department labels and the total amount of Purchase order spent by each department.
General/Purchase By Country
Introduction/Purpose
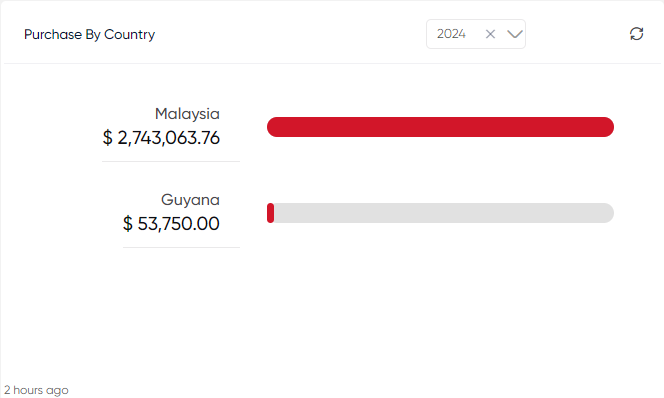
The "Purchase By Country" widget in the procurement system dashboard provides information about the purchase amount categorized by different countries.
- It defaults to displaying data for the current financial year.
- Users can select a different financial year from a list within the widget.
- The widget allows for easy analysis and comparison of purchase amounts across different countries.
- It offers valuable insights into the distribution of procurement activities among various regions.
General/Purchase Amount Breakdown
Introduction/Purpose
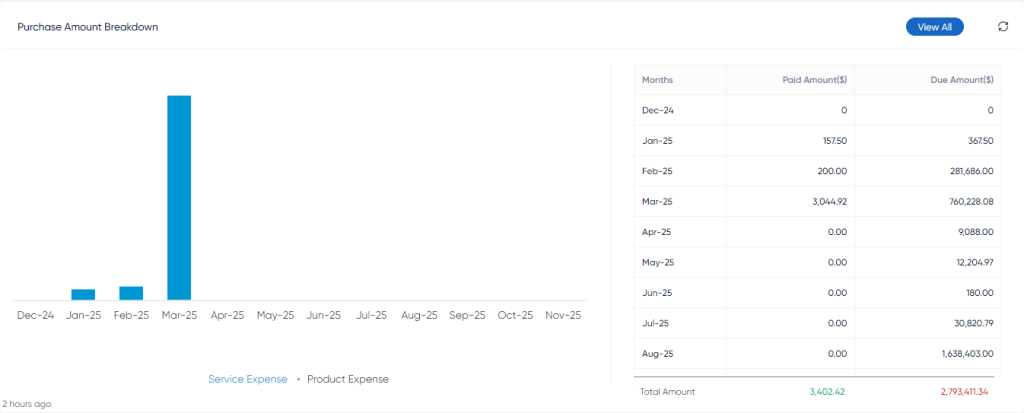
The "Purchase Amount Breakdown" widget in the procurement system presents a month-wise bar graph.
- The bar graph represents the paid amount for purchase orders (product expenses) and purchase order services (service expenses).
- On the right side, a table view displays the same information with the month-wise total paid amount and balance due amount.
- Clicking the "View All" button provides a list of pending vouchers, grouped by month.
- The list includes details such as PO/POS code, vendor name, voucher type, date, currency, amount, paid amount, due amount, and voucher status.
- The list of pending vouchers can be downloaded in PDF and CSV formats and Sent as Email attachment.
General/Open Purchase Order / Service
Introduction/Purpose
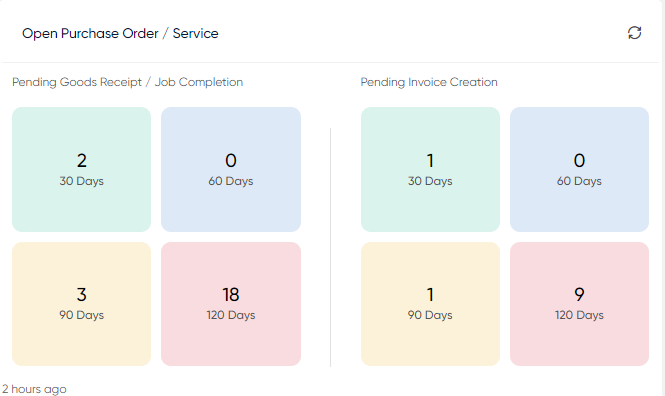
The "Open Purchase Order / Service" widget in the procurement system displays counts of pending purchase orders for goods receipt or job completion and pending orders for invoice creation.
- The counts are grouped into 30, 60, 90, and 120-day formats, indicating the age of the pending orders.
- This widget assists in managing the procurement process by highlighting orders that require attention or further actions, such as goods receipt or Job Completion.
- The widget provides a summarized view of the number of open purchase orders or services at different stages of completion like Pending for Invoice Creation.
- It helps users identify and track pending orders based on their aging, enabling efficient monitoring and follow-up actions.
General/Purchase Order
Introduction/Purpose
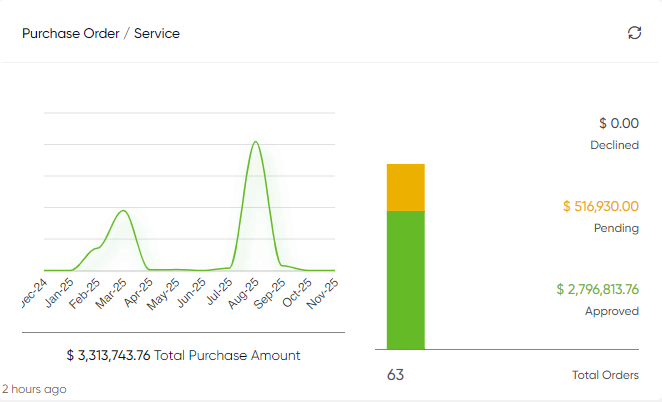
The "Purchase Order" widget in the procurement system dashboard displays a month-wise line graph representing the purchase order amounts over time.
- It includes the current month, the previous 7 months, and the next 1 month in the graph, providing a comprehensive view of purchase order trends.
- The widget also presents a summary of the total amount of purchase orders categorized as Rejected, Pending, and Approved.
- Additionally, it shows the total count of all purchase orders.
- The graph and summary information enable users to track purchase order trends, identify fluctuations, and monitor the status of different types of purchase orders (Rejected, Pending, Approved).
- This graphical representation enhances visibility and decision-making in the procurement process.
General/Top 5 Department By Purchase Amount
Introduction/Purpose
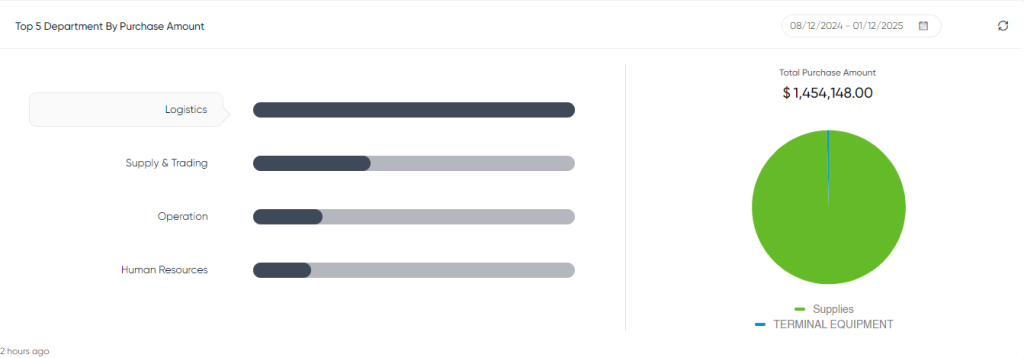
The "Top 5 Department By Purchase Amount" widget in the procurement system dashboard displays the top 5 departments based on their purchase amounts.
- The purchase amounts of these departments are presented in a horizontal bar graph format.
- Clicking on any department in the bar graph provides further information.
- On clicking a department, a category-wise pie graph is shown, representing the total amount spent by that department in different categories.
- This widget allows users to quickly identify the top 5 departments with the highest purchase amounts and gain insights into their spending patterns across various categories.
- The graphical representation enhances visual analysis and decision-making in the procurement process.
General/Recent Purchase Requisition
Introduction/Purpose
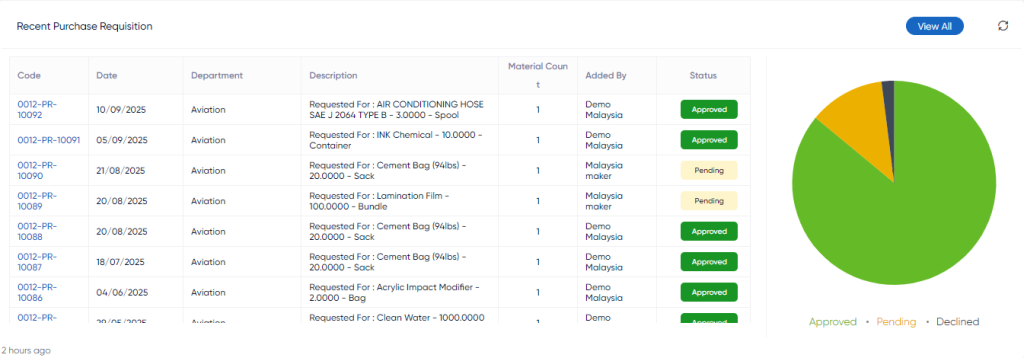
This dashboard element enables users to quickly view and manage the latest requisition requests, access detailed information, and analyze the status distribution for effective procurement decision-making.
- The "Recent Purchase Requisition" widget in the procurement system dashboard displays a list of the latest 20 requisition requests.
- The list includes information such as requisition code, date, department, material count, added by (user who created the requisition), and status of the requisition.
- Users can click on the "View All" button to access a comprehensive list of all requisition requests.
- The comprehensive list can be downloaded in PDF and CSV formats and shared via email.
- Additionally, the widget includes a pie chart that summarizes the count of accepted, pending, and rejected requisition requests.
- The pie chart provides a visual representation of the distribution of requisition request statuses.
General/Avg. Procurement Life Cycle
Introduction/Purpose
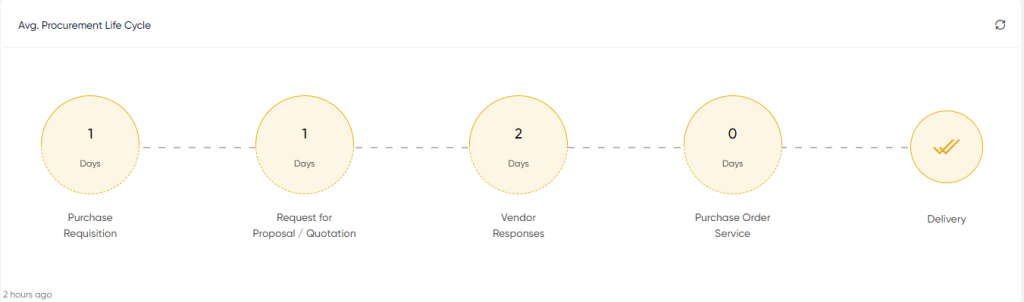
"Avg. Procurement Life Cycle" widget in the procurement system dashboard displays average durations for different stages of the procurement process.
- It includes metrics like Avg Days to Convert from Purchase Requisition to Proposal/Quotation,
- Avg Days to Convert from Proposal/Quotation to Vendor Responses,
- Avg Days to Convert Vendor Responses to Purchase Order/Service,
- And Avg Days to Get Delivery from Purchase Order/Service.
- These metrics provide insights into the efficiency of the procurement process and help identify potential delays or bottlenecks.
- Users can use this information to streamline and optimize the procurement life cycle for better performance and decision-making.
General/New Vendors (Registered in Last 30 Days)
Introduction/Purpose
The "New Vendors" widget in the procurement system dashboard displays a list of vendors registered within the last 30 days.
- It includes their name, FINAS code, email, mobile number, preferred currency, and registration date. This widget helps users stay updated on recently added vendors for improved communication and engagement in the procurement process.
General/Top 5 Vendors By Rating
Introduction/Purpose
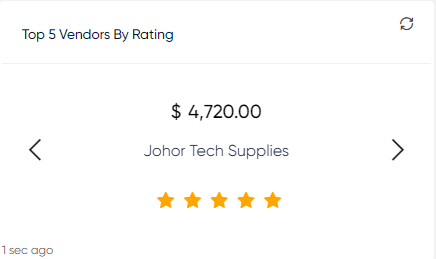
The "Top 5 Vendors By Rating" widget in the procurement system dashboard displays the top vendors based on their ratings.
- The vendors are ranked according to their ratings, with the highest-rated vendors listed at the top.
- The widget also shows the last purchase order amount for each of the top 5 vendors.
- This widget allows users to quickly identify the best-performing vendors based on their ratings and view their most recent purchase order amounts.
- It facilitates better decision-making by enabling users to prioritize and engage with highly-rated vendors for future procurement activities.
General/Contract Spendings
Introduction/Purpose
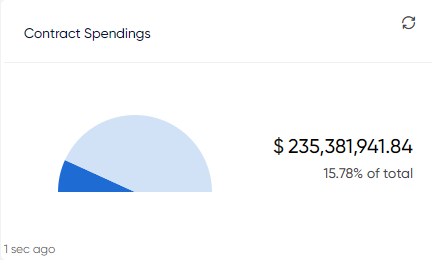
The "Contract Spendings" widget in the procurement system dashboard displays contract spendings in a semicircle chart.
- The chart visually represents the proportion of total spending that is allocated to contracts.
- The semicircle chart indicates the percentage or amount of money spent on procurement activities conducted through contracts.
- This widget provides a clear and concise overview of the significance of contracts in the overall spending of the procurement system.
- It helps users understand the impact of contract-based procurement on the organization's expenses and aids in monitoring compliance with contract terms and conditions.
General/Delivery Time Summary
Introduction/Purpose
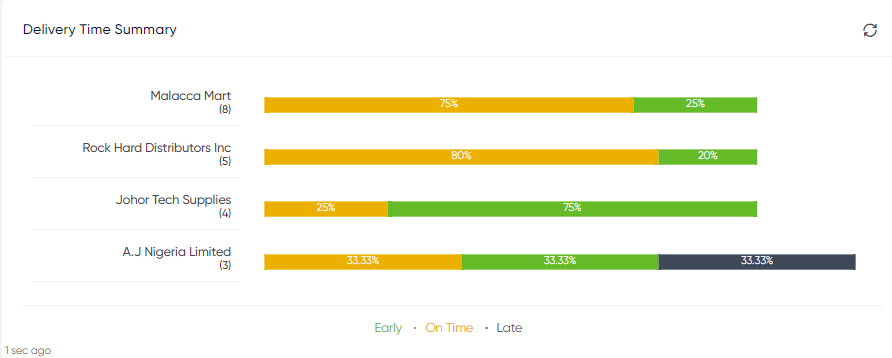
The "Delivery Time Summary" widget in the procurement system dashboard provides a summary of delivery performance by vendors.
- The widget includes a stacked bar chart representing the total delivery count for each vendor.
- Within the stacked bar chart, each vendor's deliveries are further categorized as Early, On time, or Late.
- The chart visually illustrates the distribution of delivery performance for each vendor.
- Users can quickly identify vendors with the highest number of deliveries and assess their delivery time performance.
- This widget helps in monitoring vendor compliance with delivery timelines and enables better vendor management and decision-making in the procurement process.
General/Vendors Summary
Introduction/Purpose
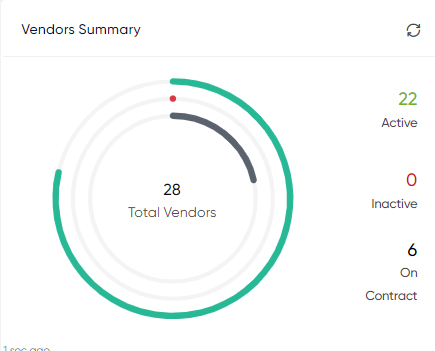
The "Vendor Summary" widget in the procurement system dashboard provides a summary of vendor information.
It displays the total count of vendors registered in the system.
- The widget further categorizes vendors into different statuses: Active, Inactive, and On Contract.
- The count of vendors in each status is shown, allowing users to quickly grasp the distribution of vendors based on their status.
- This widget offers an overview of vendor management, indicating the number of active vendors available for procurement, inactive vendors, and vendors currently under contract.
- It supports efficient vendor tracking and decision-making in the procurement process.
General/Top 5 Vendors By Cost Reduction
Introduction/Purpose
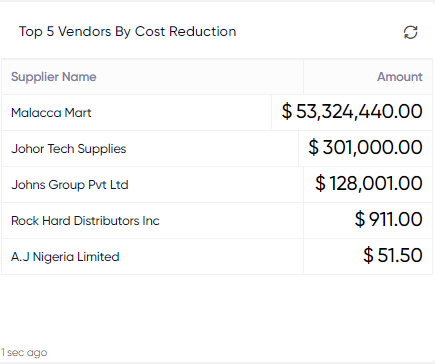
The "Top 5 Vendors by Cost Reduction" widget in the procurement system dashboard displays the vendors who have provided the highest overall cost reductions.
- The vendors are ranked based on the total amount of discounts they have offered until the current date.
- The widget presents the top 5 vendors with the most significant cost reductions, helping users identify key suppliers that contribute to cost savings.
- This information is valuable for procurement teams to engage and collaborate with vendors who consistently provide cost-effective solutions.
General/Contract Timeline
Introduction/Purpose
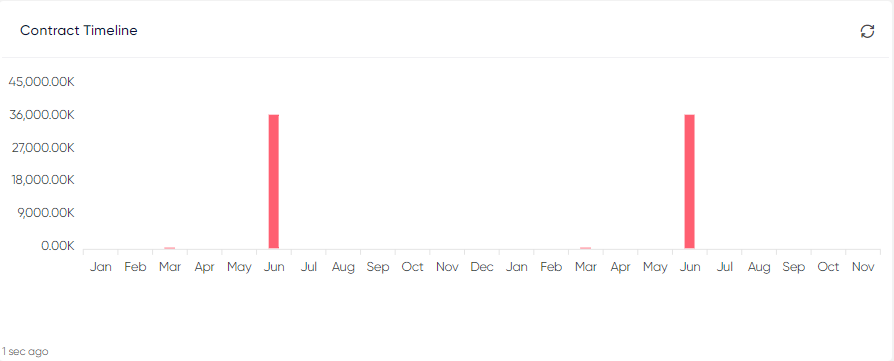
The Contract Timeline provides a month-by-month visualization of contract values executed over the year. Its purpose is to give stakeholders a quick view of contract activity patterns, highlight peak months of contract closures, and enable better forecasting of future opportunities. By analyzing this timeline, organizations can identify seasonal trends, track financial impact, and align resource planning with contract execution cycles.
General/Vendor Proposal Response
Introduction/Purpose
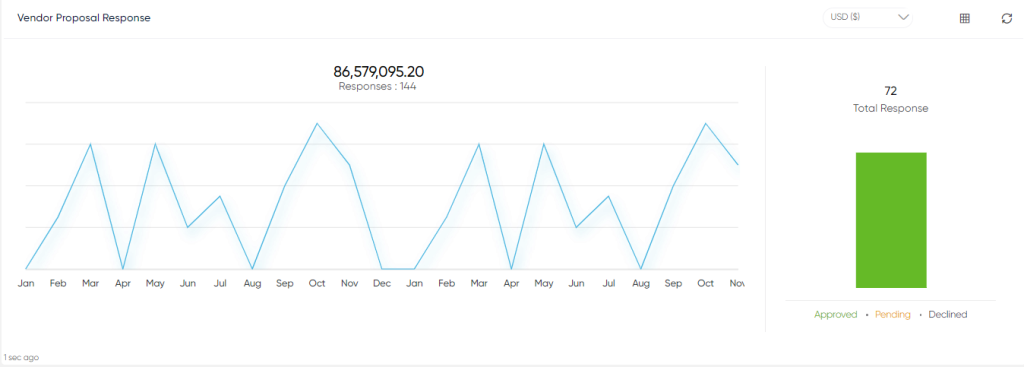
The "Vendor Proposal Response" widget in the procurement system dashboard displays vendor response data over time in a month-wise line chart.
- The line chart shows the count of vendor responses received for different months, enabling users to track response trends.
- The widget also includes bar graphs that segregate the total responses into three categories: Approved, Pending, and Rejected statuses, providing a visual representation of the response distribution.
- Users have the option to filter the data based on different currencies, allowing them to analyze responses in specific currency contexts.
- Additionally, the widget allows users to view the latest 20 records in a listing format, providing detailed information on each vendor response.
- This widget aids in assessing vendor engagement and response patterns, streamlining the vendor selection process, and ensuring effective management of proposals.
General/Vendor Payment Summary
Introduction/Purpose
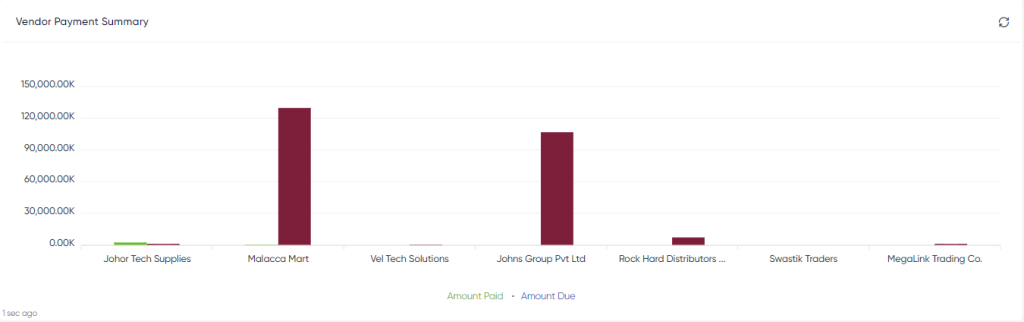
The "Vendor Payment Summary" widget in the procurement system dashboard presents a bar graph.
- The bar graph compares the paid amount and due amount for each vendor.
- Each vendor is represented as a separate bar, with the length of the bar indicating the total paid amount and the remaining portion representing the due amount.
- This visualization allows users to quickly assess the payment status for different vendors and identify any outstanding dues.
- The widget provides a clear overview of vendor payment statuses, facilitating effective vendor management and ensuring timely payments.
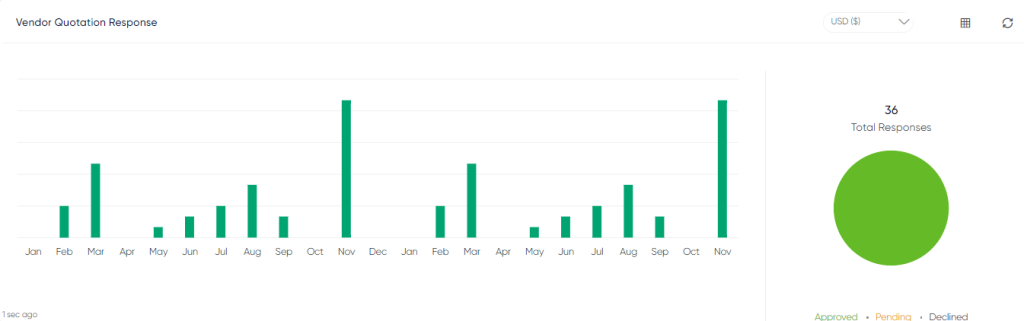
General/Vendor Quotation Response
Introduction/Purpose
The "Vendor Quotation Response" widget in the procurement system dashboard displays vendor quotation response data in two graphical formats.
- The month-wise bar chart shows the count of vendor responses received for different months, allowing users to track response trends over time.
- The pie chart segregates the total responses into three categories: Approved, Pending, and Rejected statuses, providing a visual breakdown of the response distribution.
- Users have the option to filter the data based on different currencies, enabling analysis of responses in specific currency contexts.
- The widget also allows users to view the latest 20 records in a listing format, providing detailed information on each vendor's quotation response.
- This widget helps users evaluate vendor engagement, response patterns, and decision-making, leading to improved procurement outcomes and efficient vendor selection processes.