Dashboard
The Performance 360 Dashboard offers a comprehensive overview of the performance management system, providing key insights through essential widgets. These include review cycle statuses (active, pending, closed), goal progress (active, closed), meeting statuses, employee performance metrics, and department-wise ratings. This centralized view helps users efficiently monitor and manage performance across individuals and teams
How to Navigate
Menu > Dashboard > Dashboard
Dashboard Records
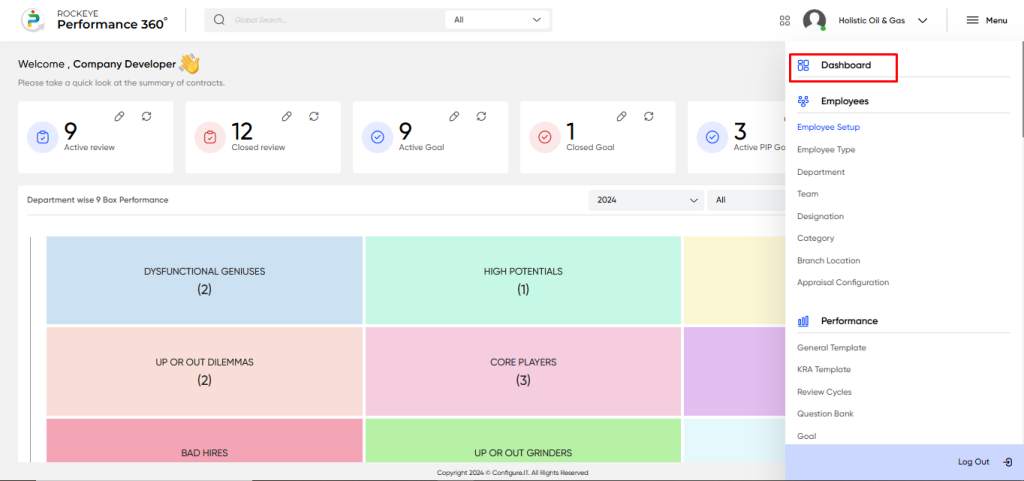
When the user clicks on the dashboard option in the menu then the user will be redirected to the below page.
Summary
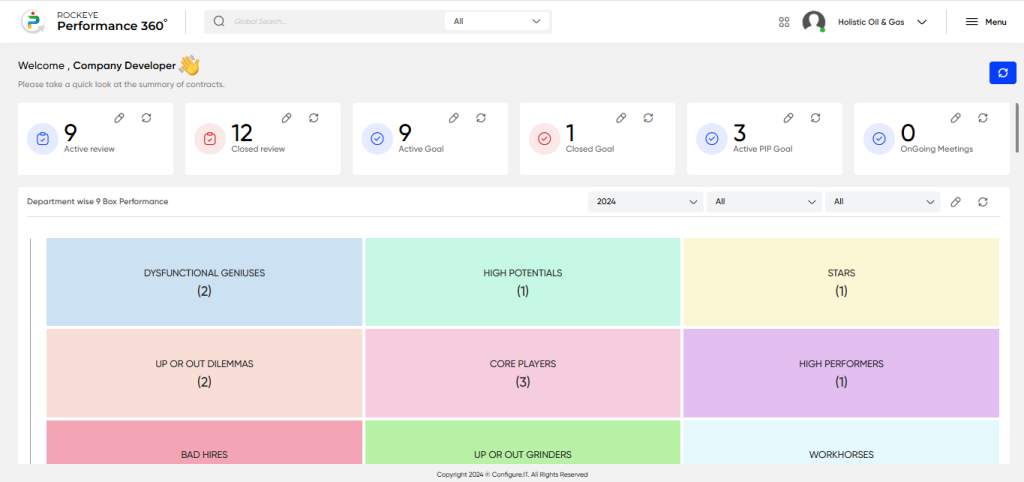
In the Summary section, users can view an overview of the performance management system, including key summaries such as Review Cycle (active, closed), Goal (active, closed), PIP (active, closed), and Ongoing Meetings. This section provides a concise snapshot to help users quickly assess the current status and progress of various performance-related activities.
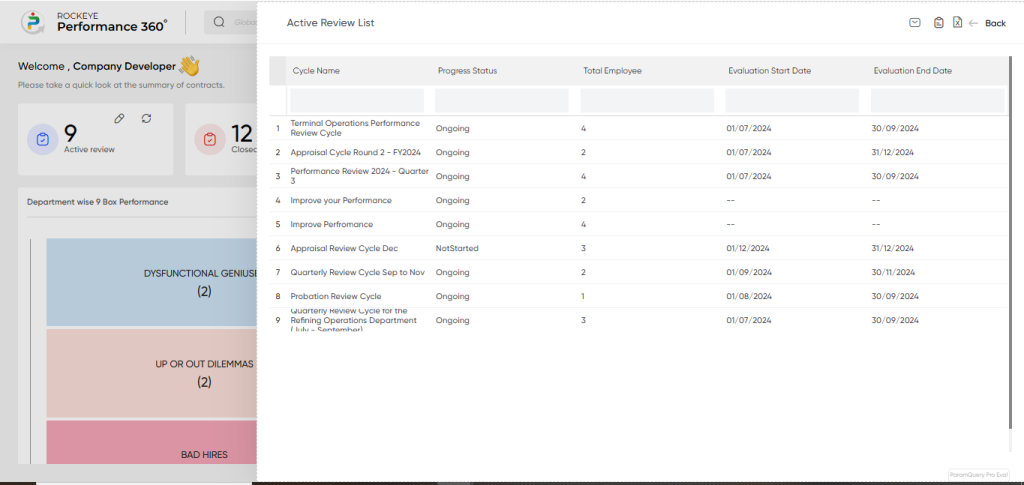
Review Cycle Summary: This widget displays the total count of active and closed review cycles, offering a quick overview of the current review status.
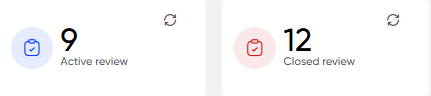
By clicking on the count, users can access a detailed list or summary of the review cycles, including information such as review titles, start and end dates, employee count, and status (active or closed), allowing for deeper insights and management
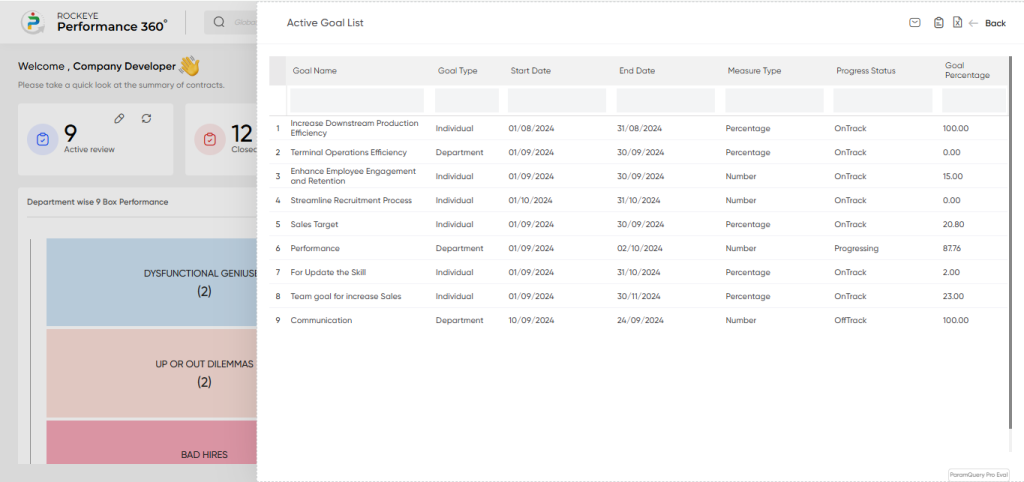
Goal Summary: This widget displays the total count of active and closed goals, offering a quick overview of the current goal status.
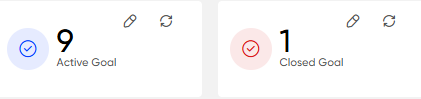
By clicking on the count, users can access a detailed list or summary of the goals, including information such as goal name, goal type, start and end dates, measure type, progress status and goal percentage, allowing for deeper insights and management
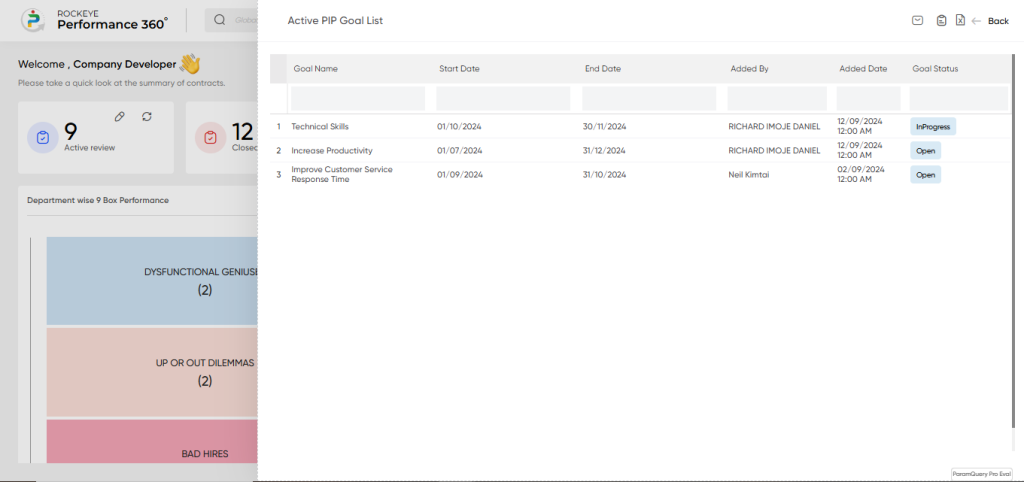
PIP goal Summary: This widget displays the total count of active PIP, offering a quick overview of the current PIP status.
By clicking on the count, users can access a detailed list or summary of the PIP goals, including information such as PIP goal name, start and end dates, goal status and goal percentage, allowing for deeper insights and management
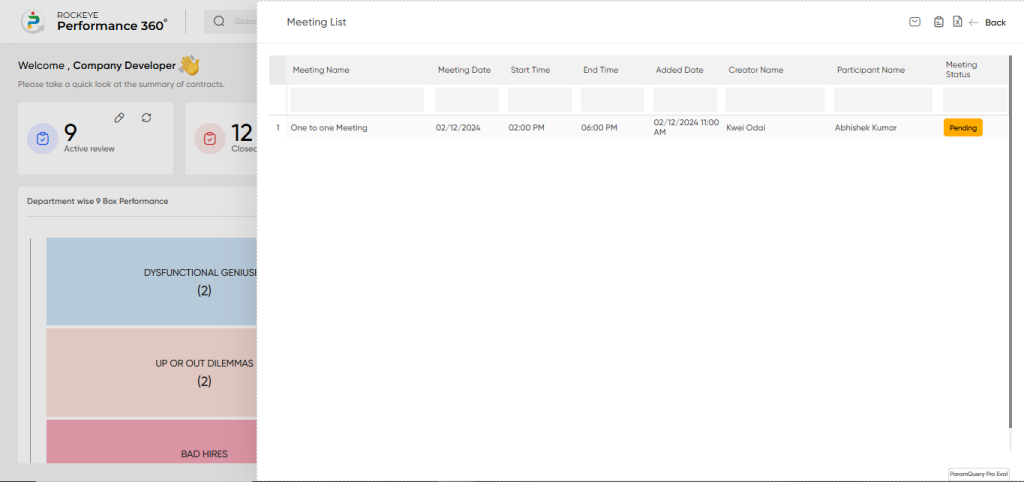
Meeting Summary: This widget displays the total count of ongoing meeting, offering a quick overview of the current meeting status.
By clicking on the count, users can access a detailed list or summary of the ongoing meetings, including information such as meeting name, meeting date, start time and end time,creator name and participant name, allowing for deeper insights and management
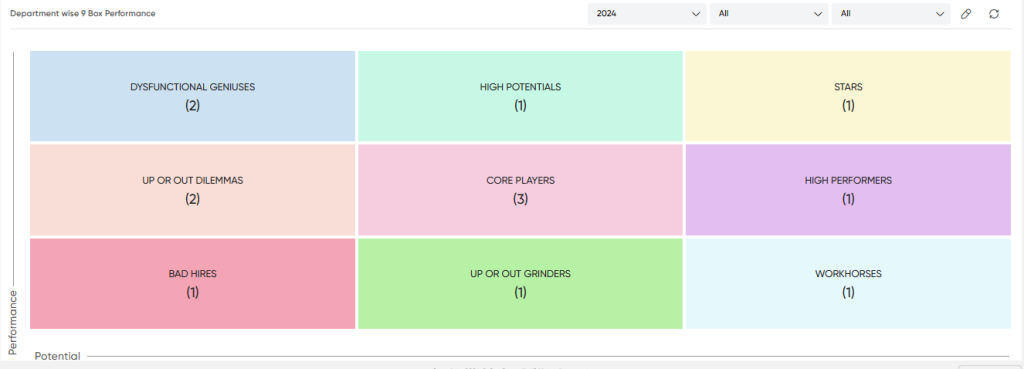
Employee Performance Metrics: This widget displays the average employee performance based on predefined categories such as Dysfunctional Genius, High Potentials, Stars, and Up-or-Out Dilemmas. Users can filter these metrics by year, review cycle, and department, allowing for a more tailored analysis of performance trends across specific time periods and organizational units. This flexibility helps managers gain deeper insights and make data-driven decisions
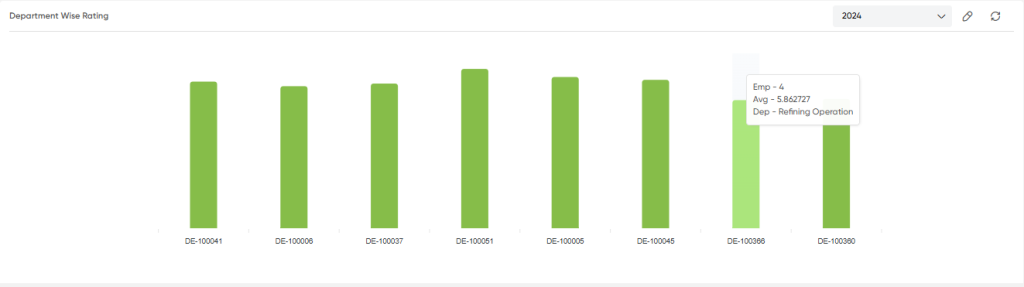
Department Wise Rating: This widget displays the average performance ratings of employees categorized by department, highlighting which departments are performing well within the organization. It provides a comparative view, enabling managers to identify high-performing teams and areas that may need additional support or resources.
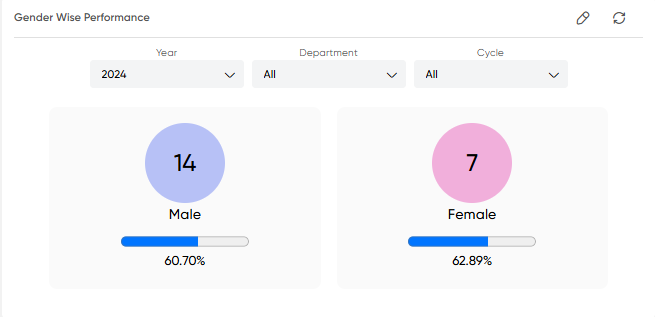
Gender Wise Performance: This widget presents employee performance ratings segmented by gender, showing both percentage and count for male and female employees. Users can filter the data by year, department, and review cycle, enabling a more detailed analysis of performance trends and fostering insights into gender-based performance patterns within the organization.
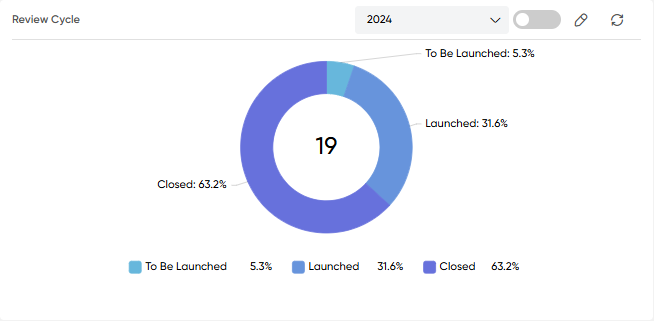
Review Cycle: This widget displays the status of review cycles, including their counts, segmented into categories such as To Be Launched, Launched, and Closed. Users can apply a yearly filter for more focused analysis and have the option to switch between chart and tabular views, providing flexibility in how the data is presented and interpreted.
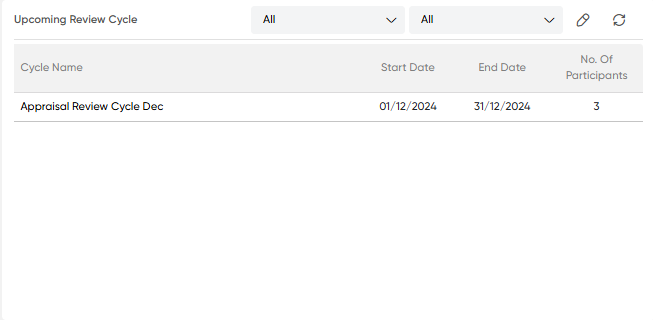
Upcoming Review Cycle: This widget presents upcoming review cycles in a tabular format, displaying key fields such as Cycle Name, Start Date, End Date, and Number of Participants. Users can filter the data by Department and Review Cycle Category (e.g., Appraisal, Probation, General), allowing for a more targeted view of upcoming cycles based on specific criteria.
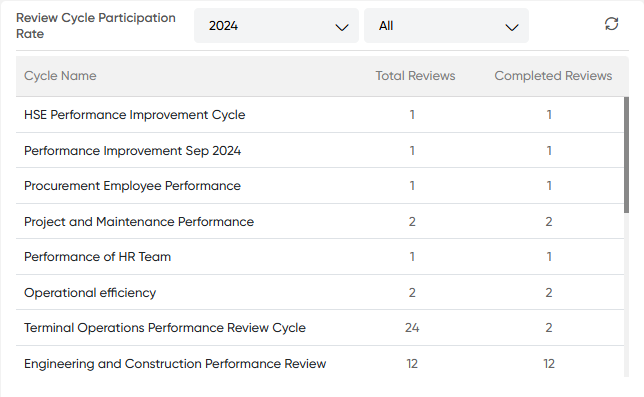
Review Cycle Participation Rate: This widget displays the employee participation rate in review cycles in a tabular format, showing key metrics such as Total Reviews and Completed Reviews. Users can filter the data by Year, providing a clear overview of participation trends and helping managers track completion rates and engagement levels across different review periods.
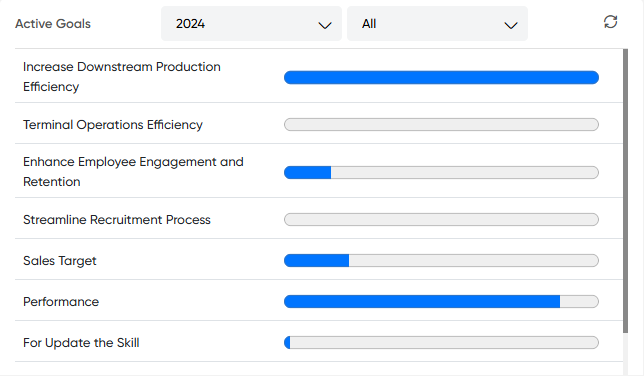
Active Goals: This widget present the active goal assigned to the employee department wise