Summary
Income:
The Income part of the Financial Accounting dashboard represents the complete revenue generated by the company over a specified time period. This includes all monetary inflows from various sources, such as product sales, service fees, investments, and other income-generating activities. This measure provides significant data about the organization’s financial health and earnings potential. The Income section of the dashboard may include information on a variety of income sources, categorizing them by product or service classifications, drawing comparisons with previous periods, and providing insights into the organization’s revenue trends.
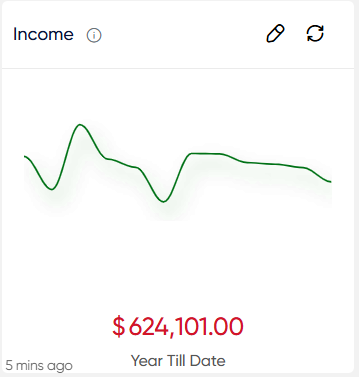
- Users will be able to see graphical representations of total income as well as the name of the current month, as well as overall income alongside year-to-date income.
- Users will be able to use the refresh icon. When users click the refresh icon, the entire income section will be updated.
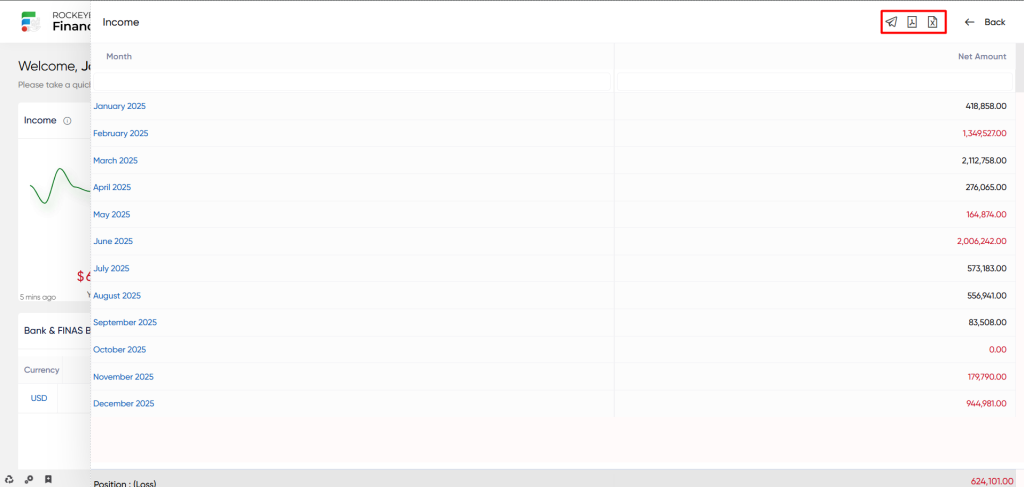
- Users are able to view a list of data with particular fields such as Account, Fas code, Expense (debit), and Income (credit).
- Users will be able to filter the data using dropdowns depending on the Date Criteria, status, and Field type.
Expenses:
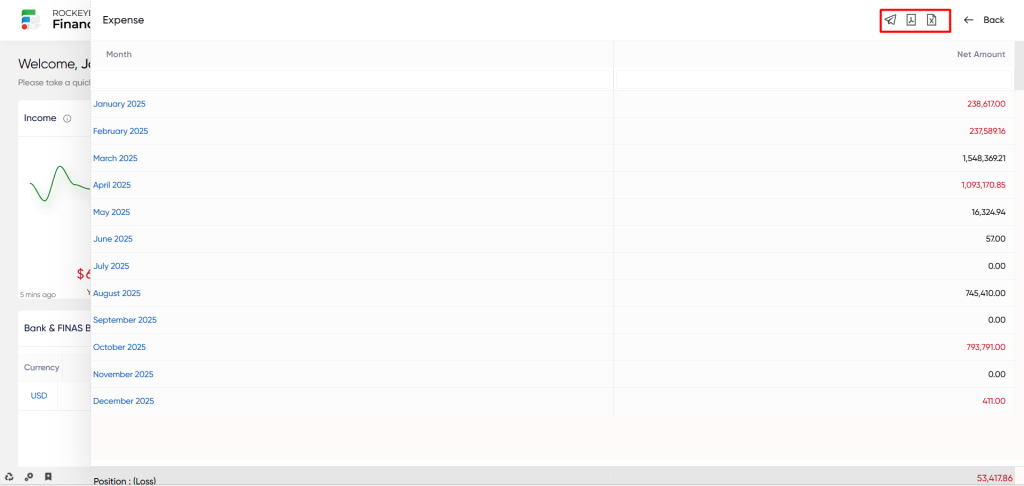
Expenses on the Finas dashboard refer to the total outlays incurred by the organization during a specified time period. These expenses include operational costs, salaries, marketing expenses, overhead fees, and any other financial outlays required for business operations. The meticulous tracking and appraisal of spending is critical for understanding the organization’s financial well-being, harmonizing budgeting efforts, and supporting informed decision-making. The dashboard’s Expenses section can provide insights into various expense categories, draw comparisons with previous periods, explain expenditure trends, and highlight potential cost-saving opportunities.

- Users will be able to see graphical representations of total expenses as well as the name of the current month, as well as overall expenses alongside year-to-date income.
- Users will be able to use the refresh icon. When users click the refresh icon, the entire expenses section will be updated.
- Users are able to view a list of data with particular fields such as Account, Fas code, Expense (debit), and Income (credit).
- Users will be able to filter the data using dropdowns depending on the Date Criteria, status, and Field type.
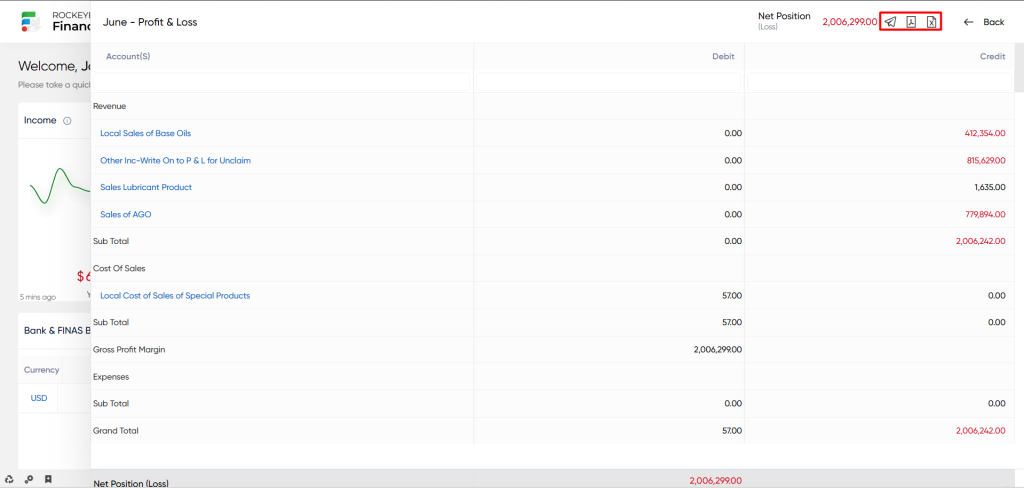
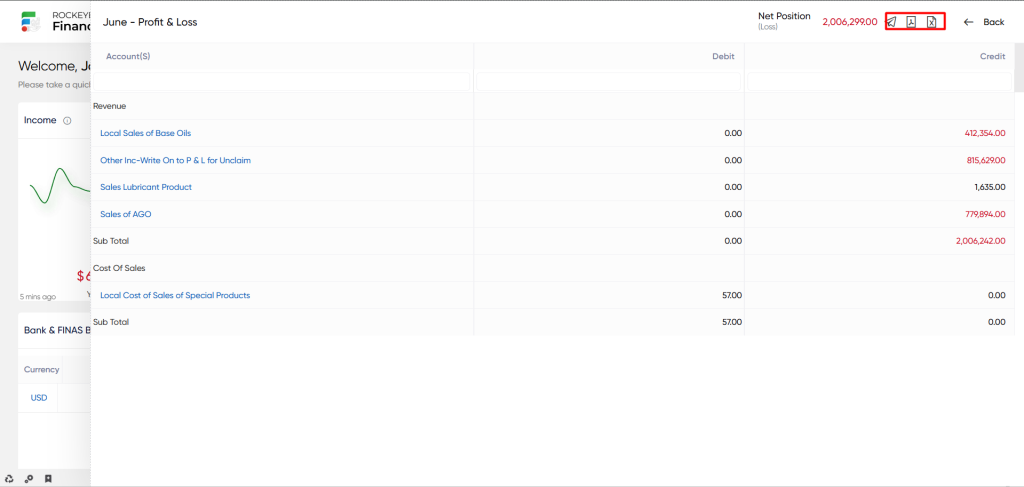
Net Profit / Loss:
The net profit/loss metric on the Finas dashboard represents the final financial outcome generated from deducting total expenses from total income during a specified period. This measure is critical as an indicator of the organization’s profitability during that time period. A positive net profit implies that revenue exceeded expenses, resulting in a profit, whereas a negative net profit shows that expenses exceeded revenue, resulting in a loss. Net profit/loss monitoring is critical for analyzing the organization’s financial performance, generating strategic decisions, and assessing the effectiveness of cost-cutting and revenue-growth programs. The dashboard’s Net Profit/Loss section has the capacity to provide detailed breakdowns of income and expenses, as well as comparisons with competitors.
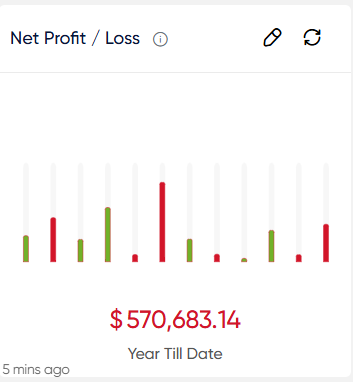
- Users will be able to see graphical representations of total Net profit / loss as well as the name of the current month, as well as overall Net profit / loss alongside year-to-date income.
- Users will be able to use the refresh icon. When users click the refresh icon, the entire net profit/loss section will be updated.
- Users are able to view a list of data with particular fields such as Account, Fas code, Expense (debit), and Income (credit).
- Users will be able to filter the data using dropdowns depending on the Date Criteria, status, and Field type.
Gross Profit / Loss:
The Gross Profit/Loss displayed on the Finas dashboard is the financial outcome obtained by deducting the cost of goods sold (COGS) from total revenue over a specified time period. This critical statistic reveals the profitability of critical business processes before considering additional operational expenses. A positive gross profit indicates that income exceeds the direct costs of producing goods or providing services, resulting in a profit. A negative gross profit, on the other hand, indicates that the cost of sold items exceeds revenue, resulting in a loss at the production level. Thorough monitoring of gross profit/loss provides critical insights into the organization’s ability to craft things or provide services in an efficient and profitable manner. The dashboard’s Gross Profit/Loss column has the potential to deliver substantial insights.
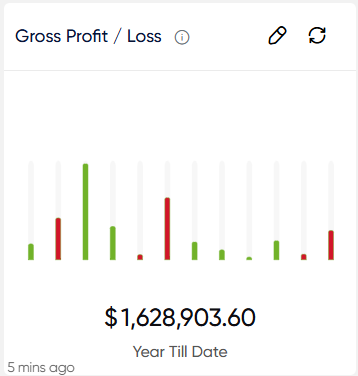
- Users will be able to see graphical representations of total Gross profit / loss as well as the name of the current month, as well as overall Gross profit / loss alongside year-to-date income.
- Users will be able to use the refresh icon. When users click the refresh icon, the entire Gross Profit/Loss section will be updated.
- Users are able to view a list of data with particular fields such as Account, Fas code, Expense (debit), and Income (credit).
- Users will be able to filter the data using dropdowns depending on the Date Criteria, status, and Field type.
Executive Summary:
The Executive Summary featured in the Finas dashboard offers a concise overview of crucial financial and operational metrics, providing high-level insights into the organization’s performance. Its primary purpose is to furnish executives and decision-makers with a rapid comprehension of the organization’s present status while highlighting significant aspects requiring attention.

This summary usually includes important information such as Cash summary, Bank summary, Profitability, and Balance Sheet.
- The user will be able to view the current and previous month’s Cash summary and Bank summary received and spent amounts. The user is able to view the current and prior month’s Direct costs, expenses, and Gross Profitability. The user can also view the balance sheet’s current and previous month’s creditors and debtors. The user can also see the variance percentage for the cash summary, bank summary, profitability, and balance sheet.
- Users will be able to choose the desired month from the dropdown for getting the data. System considered the desired selected month as the current month.
- Users will be able to use the refresh icon. When users click the refresh icon, the entire Executive Summary will be updated.
Receivable From Customer:
Receivable From Customer in the Finas dashboard refers to the total amount of money owed to the business by its customers in payment for goods or services delivered. This measure is important financially since it reflects pending payments owed by customers to the business.
- users will be able to view a pie chart visual representation of the amount’s over Received, Received, and Remaining.
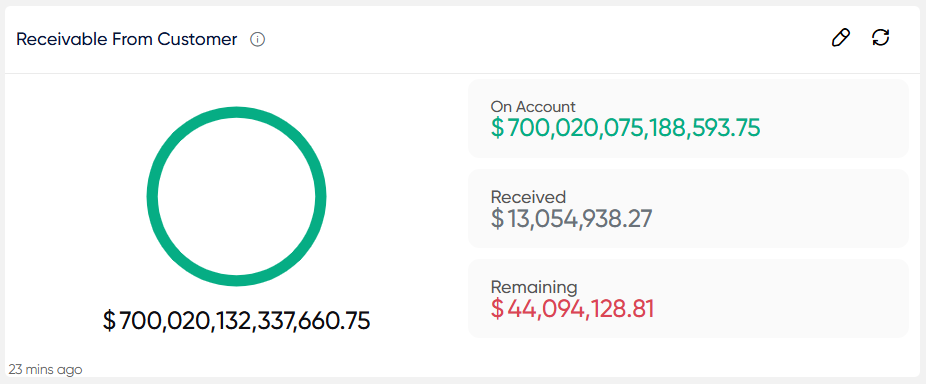
- Users will be able to use the refresh icon. When users click the refresh icon, the entire Receivable From Customer section will be updated.
- Users will be able to click on the over Received, Received, and Remaining to show the data with specific fields such are Name, FAS code, Total Need to Receive, Received, Remaining, Over Received
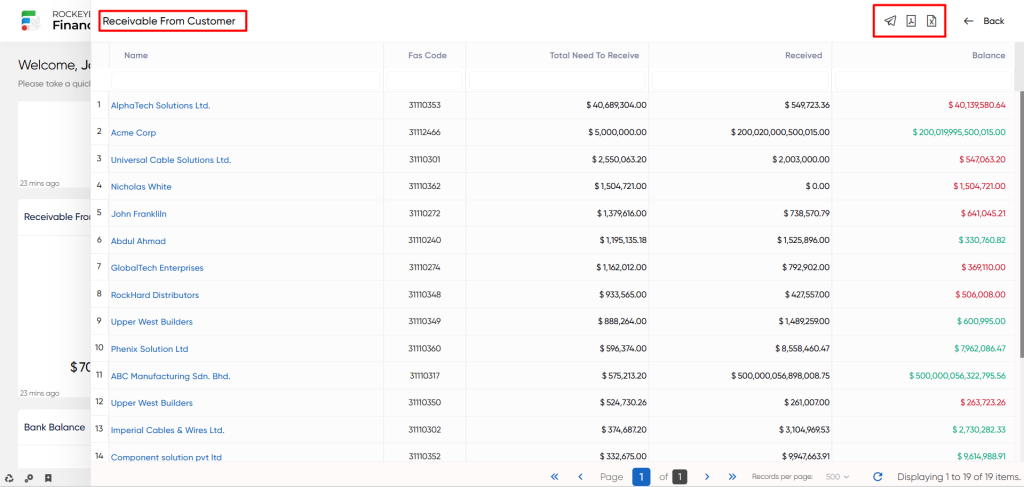
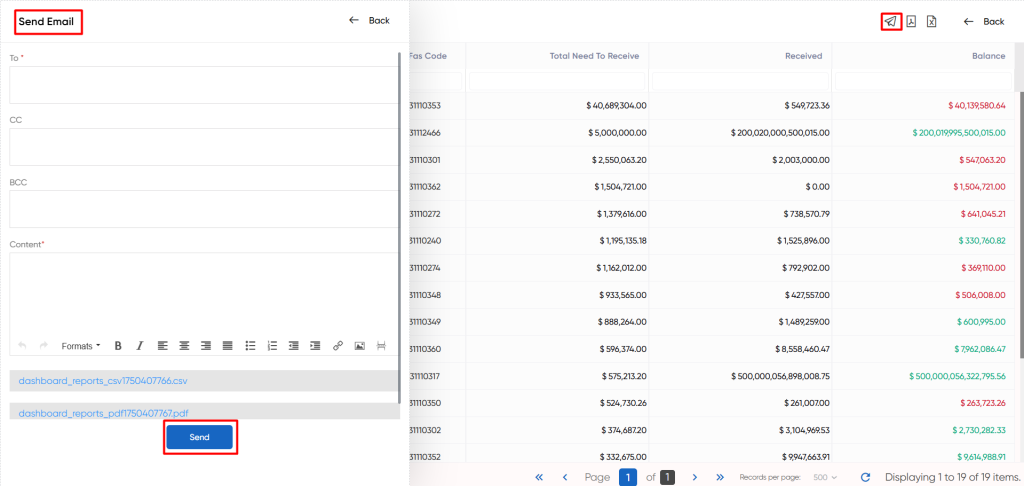
- When a user clicks the mail icon, a popup will appear, prompting the user to select between PDF, CSV, or both options. Upon choosing any of these options, the user will be directed to a page to send the selected PDF or CSV file via email.
Payable to Vendor:
The Payable to Vendor part of the Finas dashboard refers to the organization’s total monetary obligation to its vendors or suppliers in exchange for products and services received. This includes any outstanding invoices or accounts payable that must be settled with vendors. This statistic is very important in terms of effectively managing the organization’s financial responsibilities and cultivating positive supplier relationships.
- Users will be able to see a pie chart visual representation of the amount that has been overpaid, paid, and remaining.
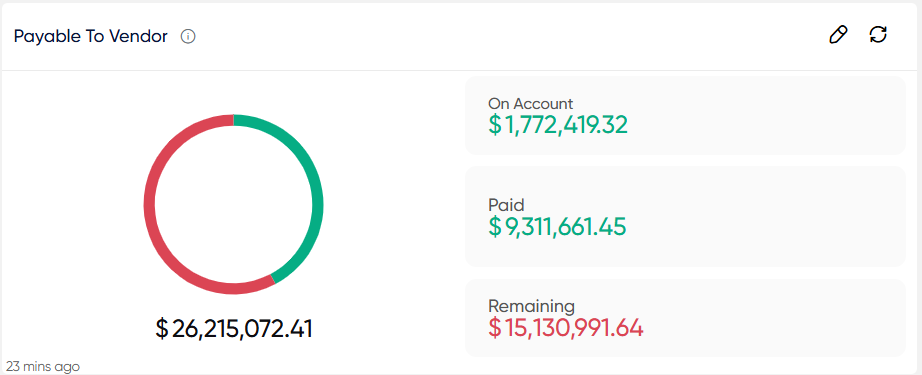
- Users will be able to use the refresh icon. When users click the refresh icon, the entire Payable to Vendor section will be updated.
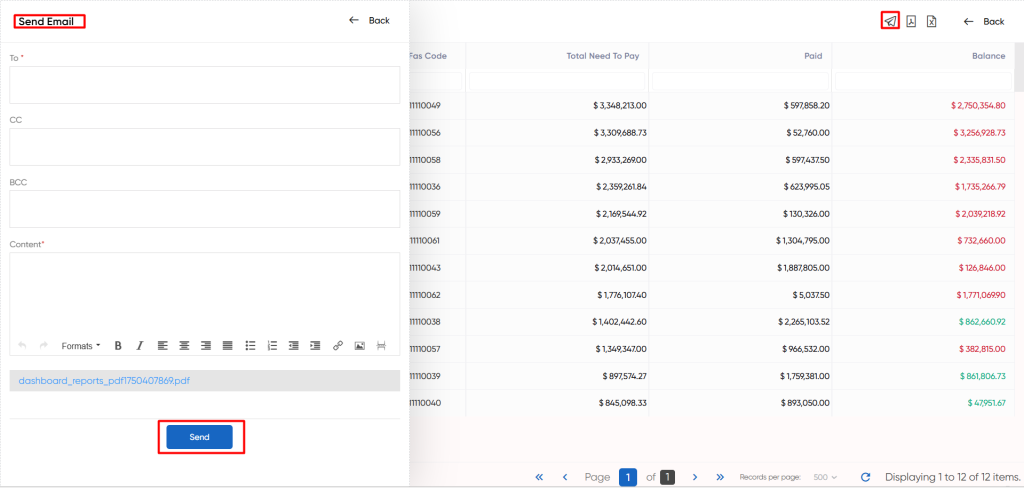
- Users will be able to click on the overPaid, Paid, and Remaining to show the data with specific fields such are Name, FAS code, Total Need to Paid, Paid, Remaining, Over Paid
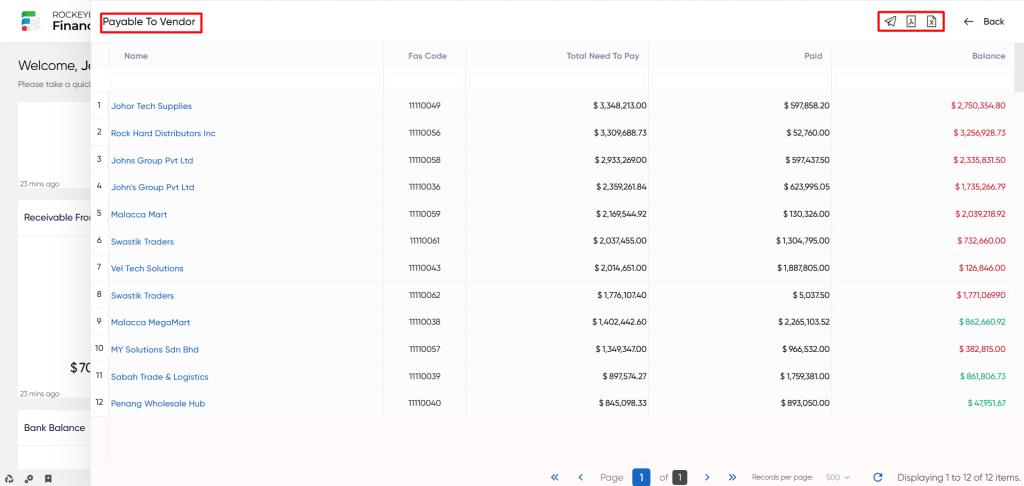
- When a user clicks the mail icon, a popup will appear, prompting the user to select between PDF, CSV, or both options. Upon choosing any of these options, the user will be directed to a page to send the selected PDF or CSV file via email.
Bank Balance:
The Bank Balance part of the Finas dashboard provides a detailed representation of the organization’s financial situation across different bank accounts. This section is critical in providing insights on the organization’s liquidity and economic well-being, as well as serving as a foundation for effective cash management.
- The user will be able to view a list of banks with Balance Amount data in a line graph format. The user will be able to see the Last Bank Statement import date as well as the statement.
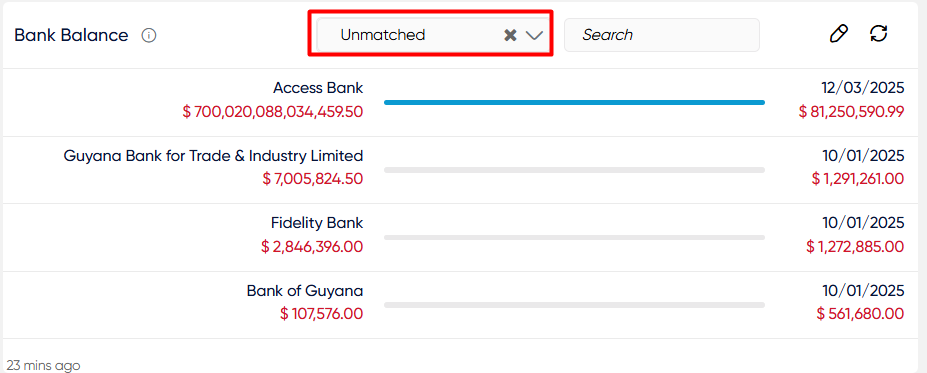
- Users will be able to use the refresh icon. When users click the refresh icon, the entire Bank Balance list will be updated.
Low-Performing Customers:
The Low Performing Customers section within the Finas dashboard identifies customers who have exhibited suboptimal performance in terms of their engagement with the organization. This section aims to highlight customers with relatively low levels of business activity or transactions, often coupled with lower monetary amounts spent or received.
- Users will be able to see the “View All” option, as well as use the refresh icon. The full low performing customer is updated when users click the refresh symbol.
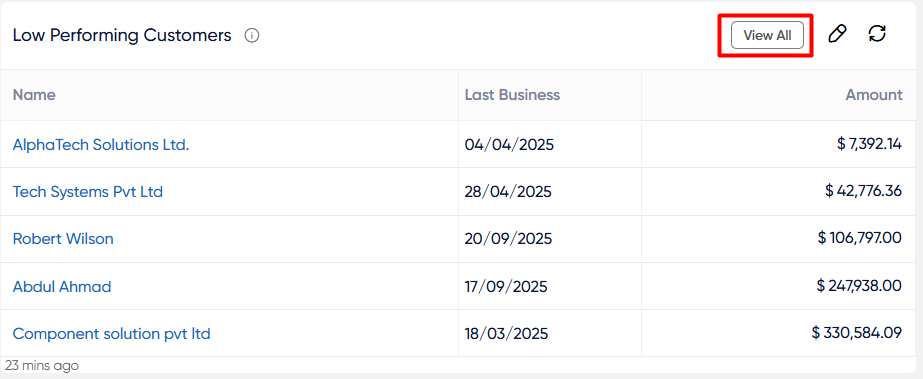
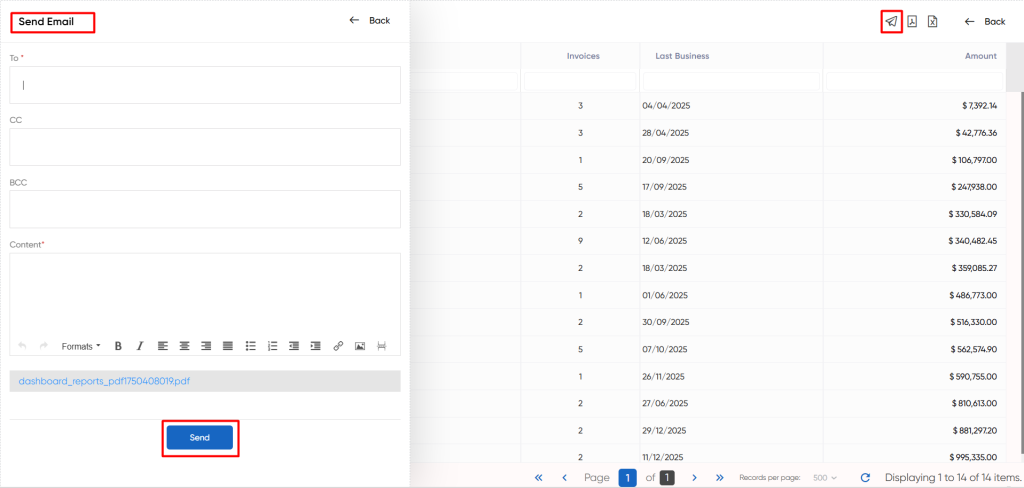
- The “View All” option allows users to access a thorough list of upcoming low performing customers. Users can view Names, invoices, Last business, and Amount listings.
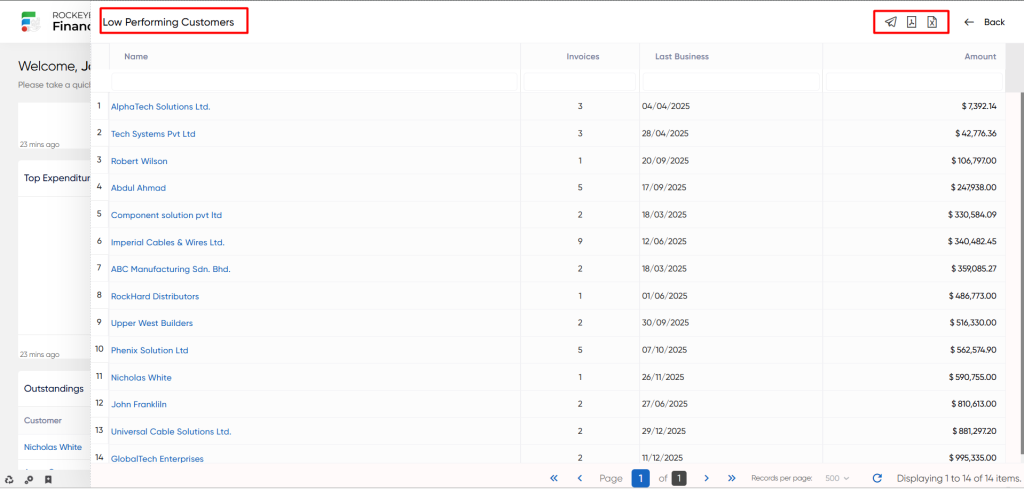
- When a user clicks the mail icon, a popup will appear, prompting the user to select between PDF, CSV, or both options. Upon choosing any of these options, the user will be directed to a page to send the selected PDF or CSV file via email.
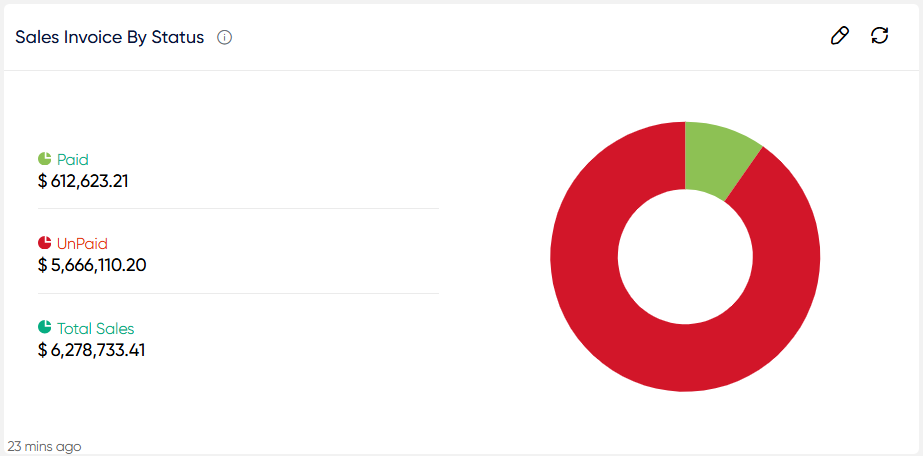
Sales Invoice By Status:
The Sales Invoice By Status a part of the Finas dashboard displays a breakdown of sales invoices based on their current payment statuses. This section’s major objective is to give a comprehensive perspective of invoice categorization based on payment statuses, providing useful insights into the organization’s sales success.
- Users will be able to see a pie chart visual representation of the amount that has been paid, partially paid, unpaid and total sales.
- Users will be able to use the refresh icon. When users click the refresh icon, the entire Sales Invoice By Status section will be updated.
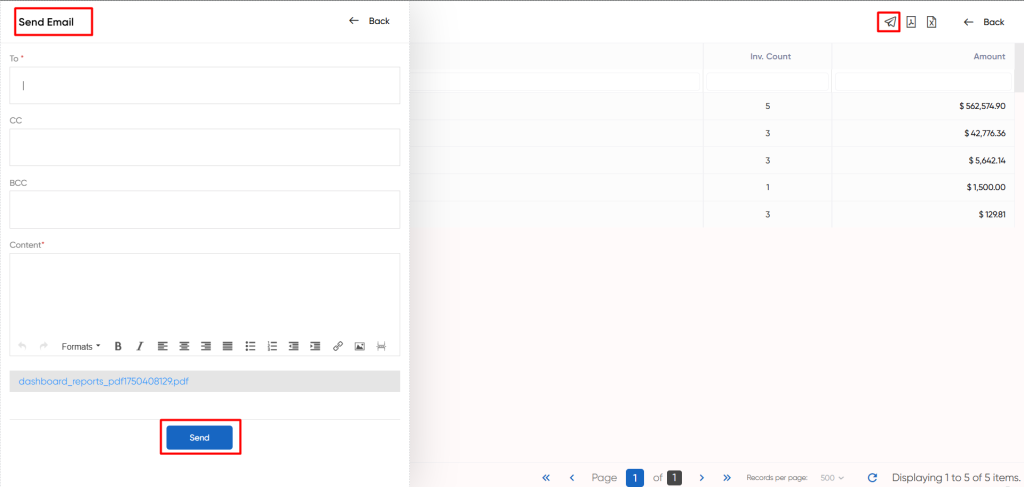
- Users will be able to click on the paid, partially paid, unpaid and total sales to show the particular data with specific fields such are Customer, Inv.count, Amount
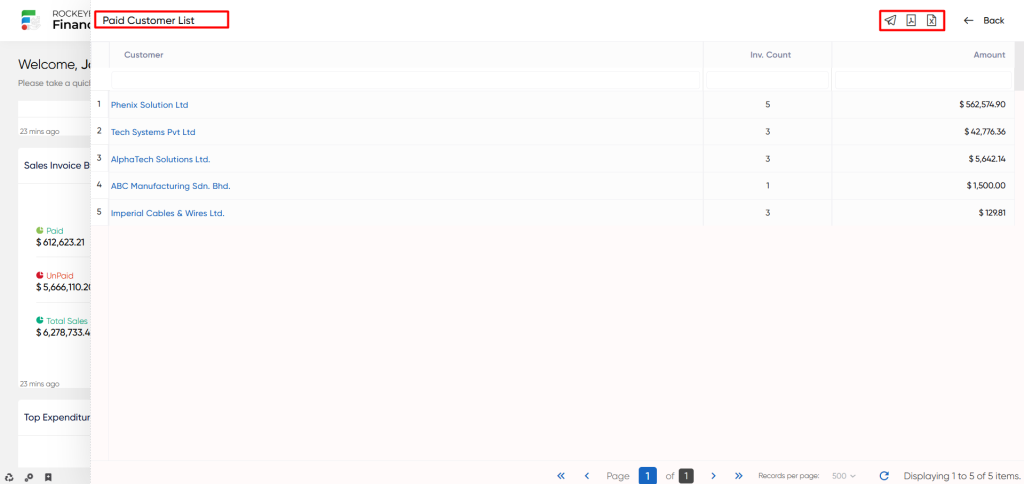
- When a user clicks the mail icon, a popup will appear, prompting the user to select between PDF, CSV, or both options. Upon choosing any of these options, the user will be directed to a page to send the selected PDF or CSV file via email.
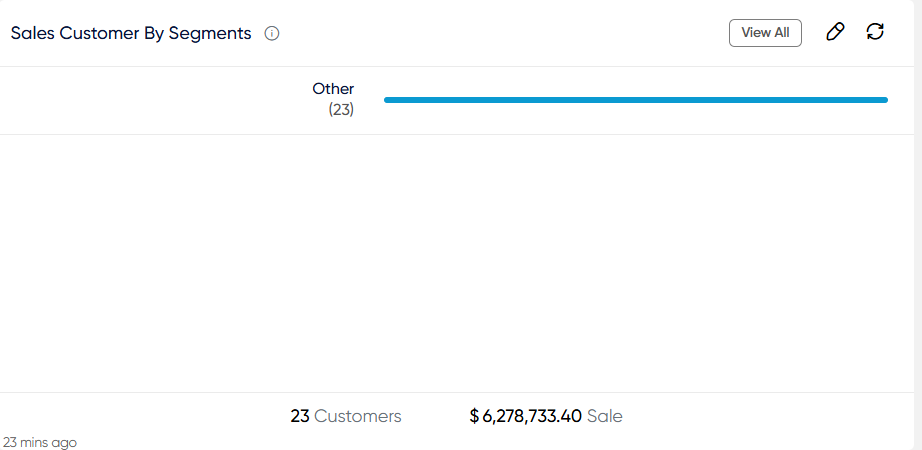
Sales Customer By Segments:
The Sales Customer By Segments section in the Finas dashboard provides an analysis of sales based on customer segments. This section aims to present a clear understanding of how sales are distributed among various customer categories, offering insights into customer behavior and preferences.
- Users will be able to see a line graph representing the various clients together with the sale amount.
- Users will be able to use the refresh icon. When users click the refresh icon, the entire Sales Customer By Segments section will be updated.
- The “View All” option allows users to access a thorough list of upcoming Sales Customer By Segments. Users can view Customer, Fas Code, Title, Amount listing.
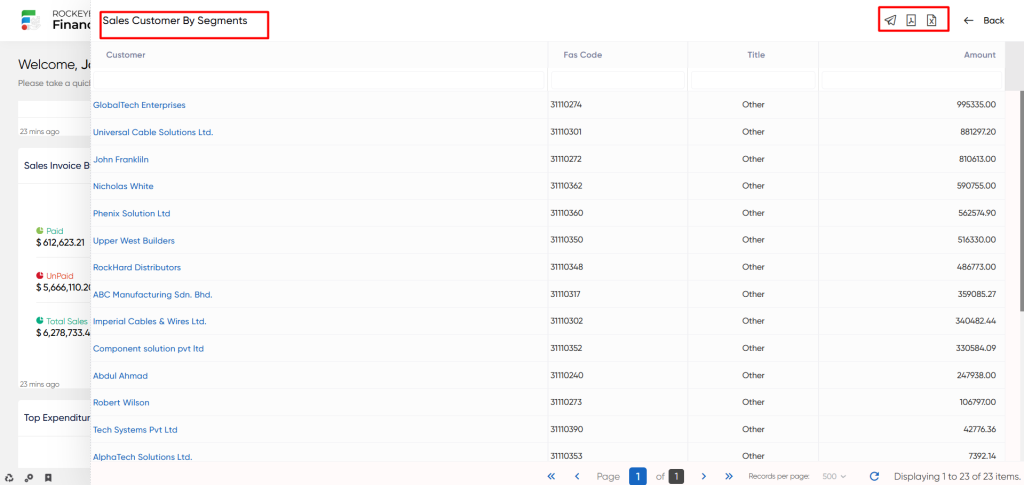
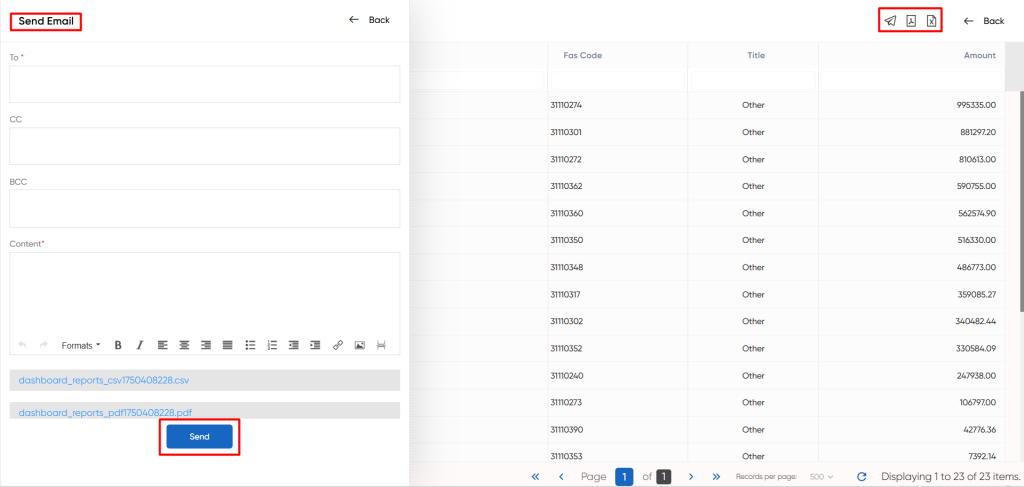
- When a user clicks the mail icon, a popup will appear, prompting the user to select between PDF, CSV, or both options. Upon choosing any of these options, the user will be directed to a page to send the selected PDF or CSV file via email.
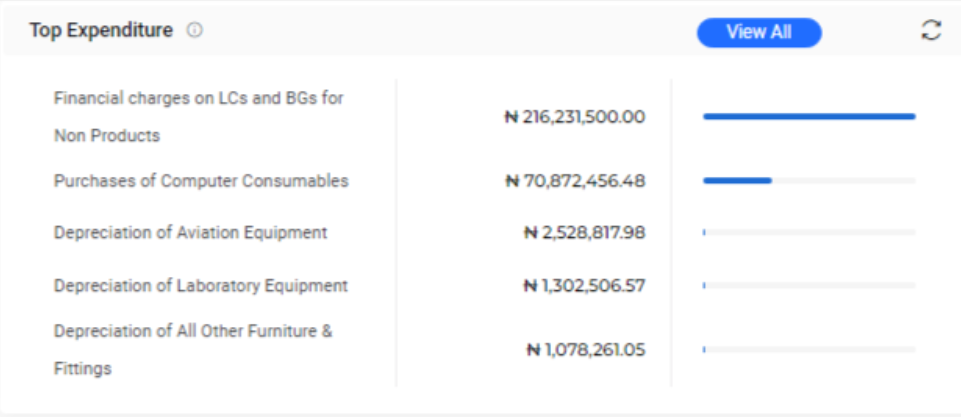
Top Expenditure:
The Top Expenditure section in the Finas dashboard displays a breakdown of the organization’s highest expenditure, categorized by gender Ledger (GL) names. This section is designed to provide a transparent overview of where significant expenses are allocated, offering insights into expense distribution and management.
- Users will be able to see a line graph representing the various highest expenditure clients together with the amount.
- Users will be able to use the refresh icon. When users click the refresh icon, the entire Sales Customer By Segments section will be updated.
- The “View All” option allows users to access a thorough list of upcoming Top Expenditures.
- Users can view GL Name, and amount listing.
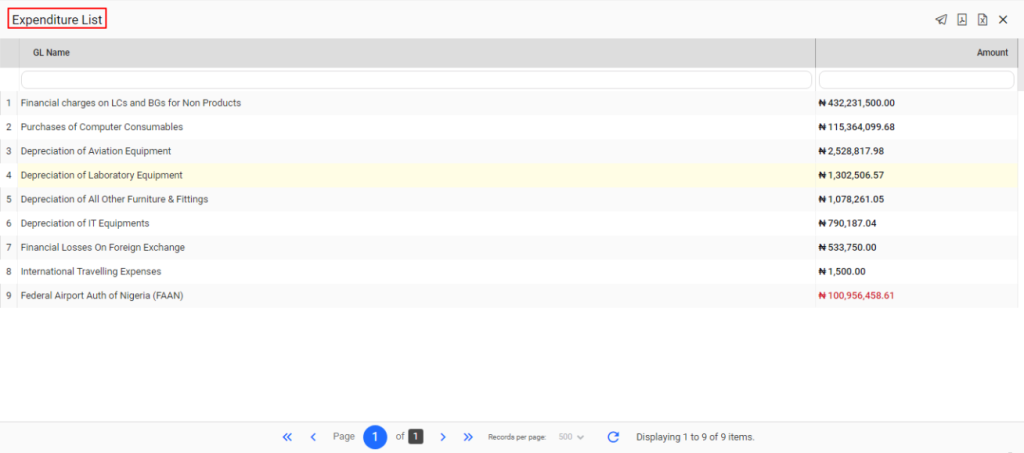
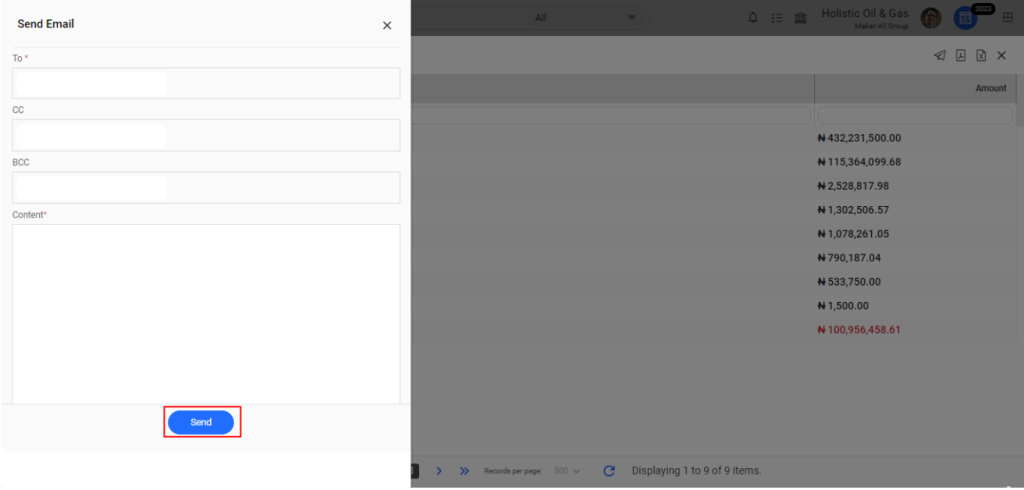
- When a user clicks the mail icon, a popup will appear, prompting the user to select between PDF, CSV, or both options. Upon choosing any of these options, the user will be directed to a page to send the selected PDF or CSV file via email.
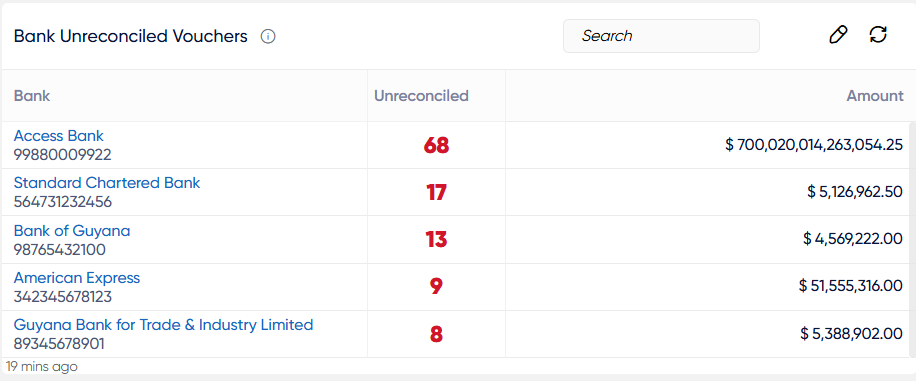
Bank Unreconciled Vouchers:
The Finas dashboard’s “Bank Unreconciled Vouchers” segment focuses on vouchers related to outstanding bank transactions that are awaiting reconciliation. This section’s primary goal is to identify transactions that have not been reconciled with the organization’s bank records. This emphasis on unmatched transactions helps to speed up the reconciliation process.
- Users will be able to see a list of Bank Names that have specific Unreconciled and the amount.
- Users will be able to use the refresh icon. When users click the refresh icon, the entire Bank Unreconciled Vouchers section will be updated.
- Users will be able to click on the specific Unreconciled to show the particular data with specific fields such are Voucher No, Name, Voucher date, Amount
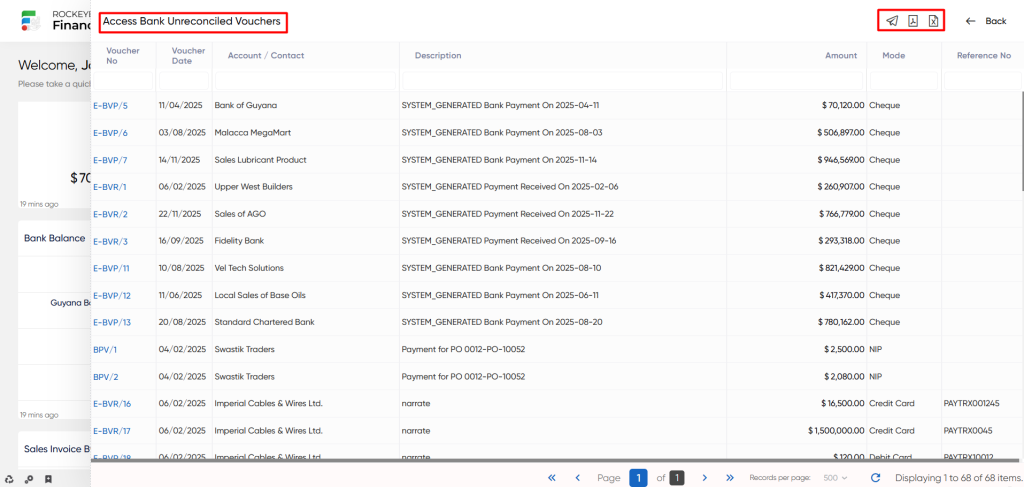
- When a user clicks the mail icon, a popup will appear, prompting the user to select between PDF, CSV, or both options. Upon choosing any of these options, the user will be directed to a page to send the selected PDF or CSV file via email.
Outstandings:
The Outstandings section within the Finas Dashboard provides a consolidated overview of unpaid amounts owed by clients. This section provides information about clients that have unresolved outstanding payments for products or services received.
- Users will be able to see the “View All” option, as well as use the refresh icon. The full Outstandings are updated when users click the refresh symbol.
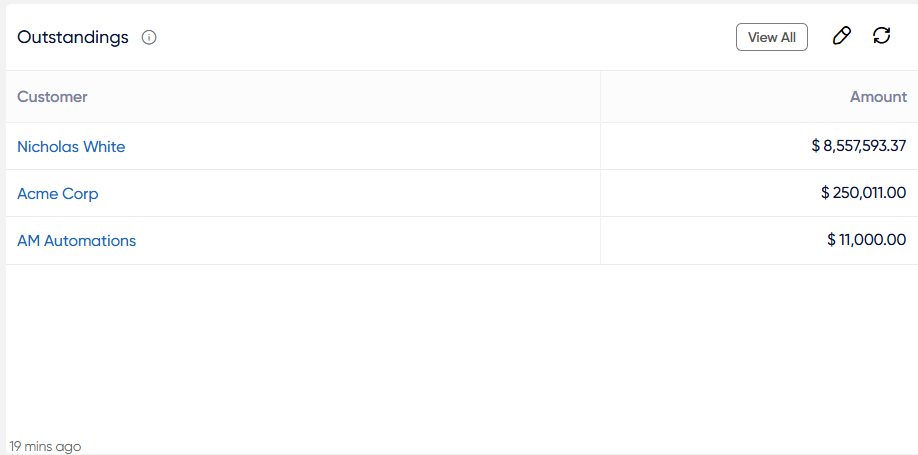
- The “View All” option allows users to access a thorough list of upcoming Outstandings. Users can view the Customer and Amount listing.
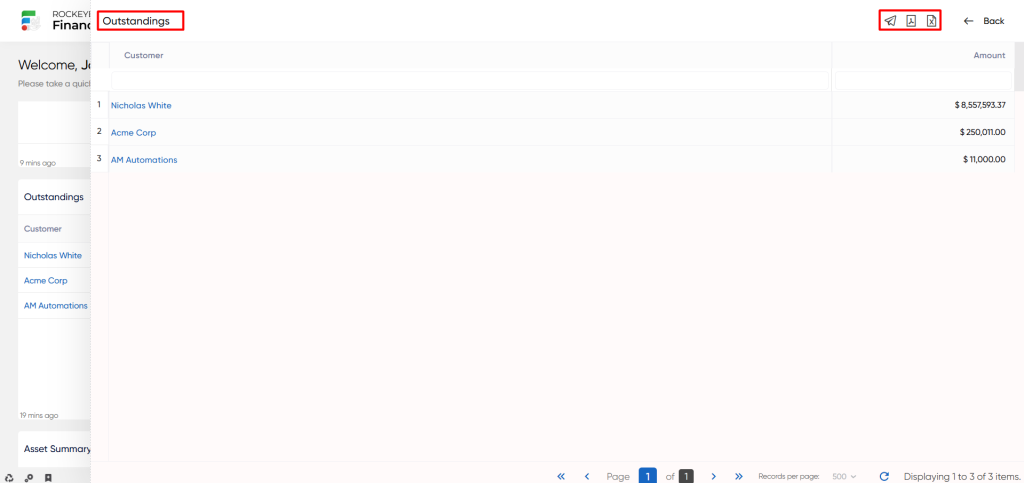
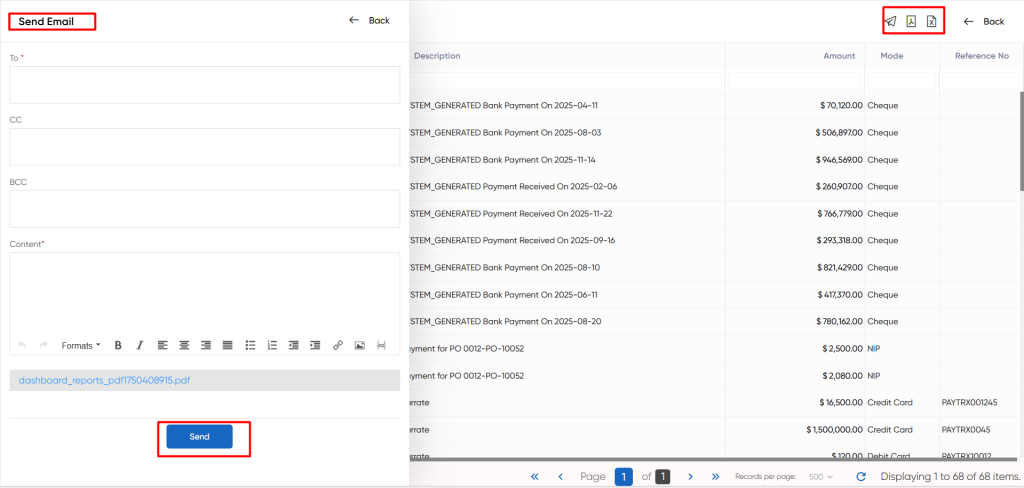
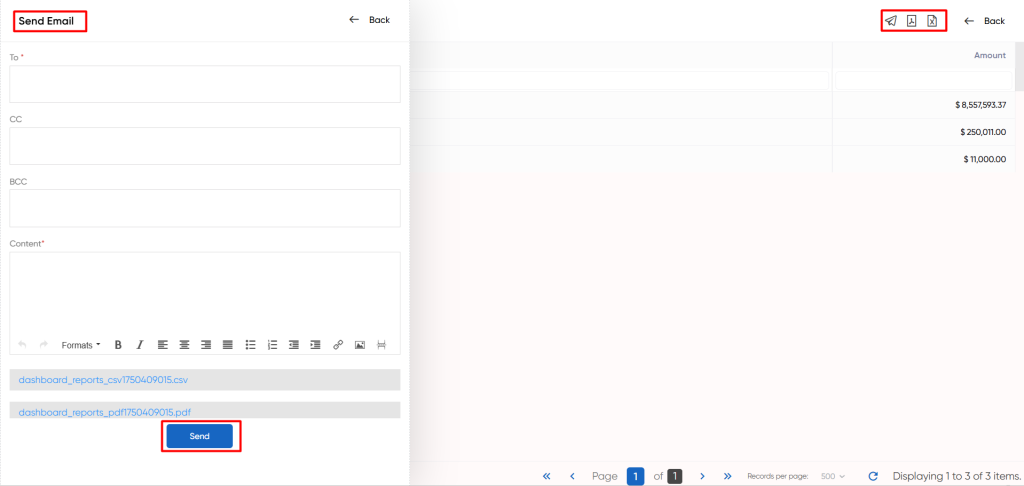
- When a user clicks the mail icon, a popup will appear, prompting the user to select between PDF, CSV, or both options. Upon choosing any of these options, the user will be directed to a page to send the selected PDF or CSV file via email.
Overdues:
Within the Finas dashboard, the Overdues section displays a list of transactions that have passed their payment due dates. This section contains information about customers, the invoices associated with them, and the amounts that have been past due.
- Users will be able to see the “View All” option, as well as use the refresh icon. The full Overdues are updated when users click the refresh symbol.
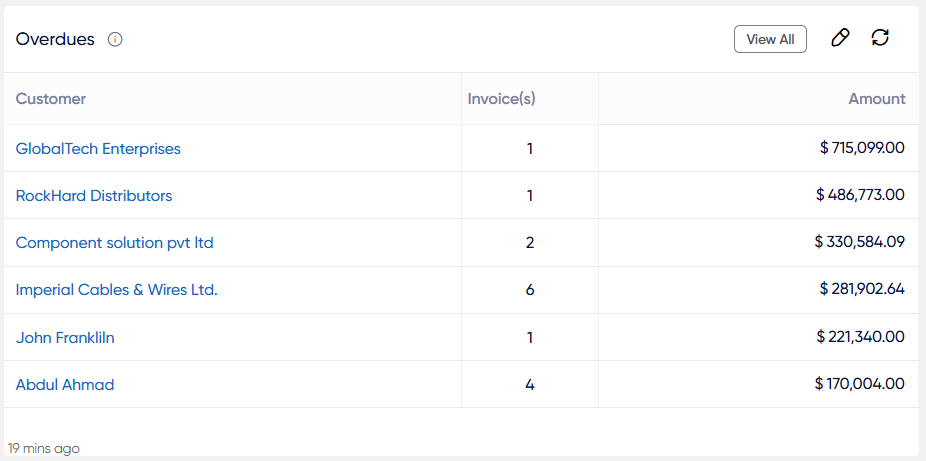
- The “View All” option allows users to access a thorough list of upcoming Overdues. Users can view the Customer, invoice(s) and Amount listing.
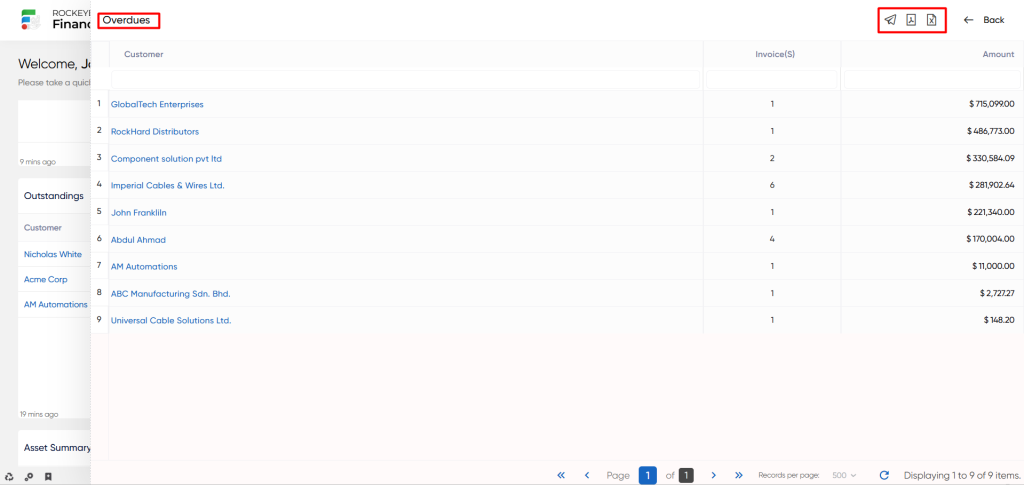
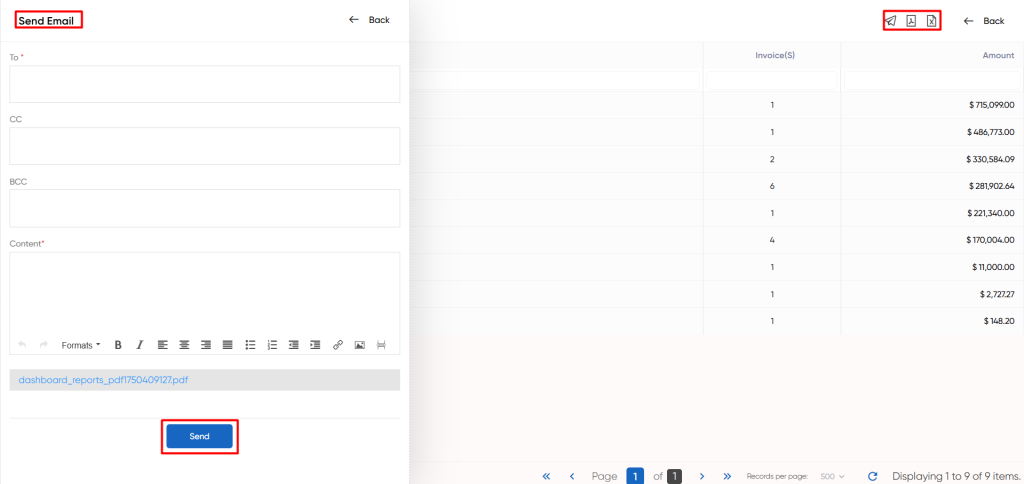
- When a user clicks the mail icon, a popup will appear, prompting the user to select between PDF, CSV, or both options. Upon choosing any of these options, the user will be directed to a page to send the selected PDF or CSV file via email.
Asset Summary:
In the Finas dashboard, the Asset Summary section offers a comprehensive portrayal of the organization’s assets. This segment delivers essential metrics and insights pertaining to diverse asset categories, thereby contributing to the enhancement of asset management practices.
- The Asset Summary encompasses details such as the upcoming Depreciation date, the classification of assets into categories like Capitalized, Assets under Construction (AUC), Pending, and Retired. It also includes the Total Capitalized Book value, Book value – under construction, and the Depreciation current financial year.
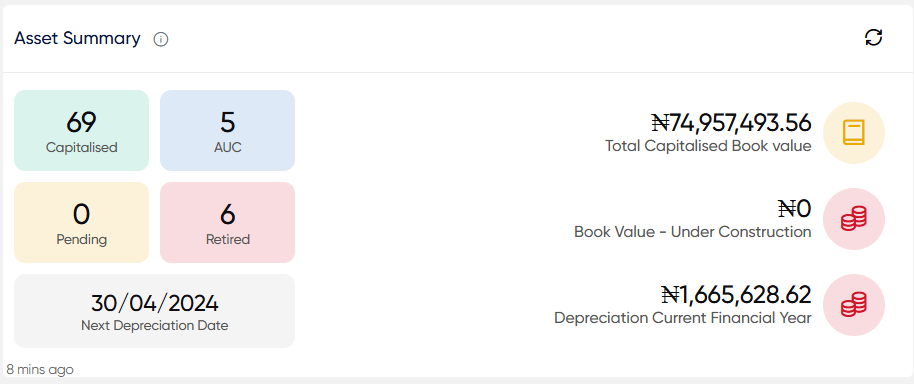
- Users will be able to use the refresh icon. When users click the refresh icon, the entire Asset Summary section will be updated.
- Users will be able to click on the specific field of asset summary to show the particular data with specific fields such are Asset No, Name, Classification, Book Value.
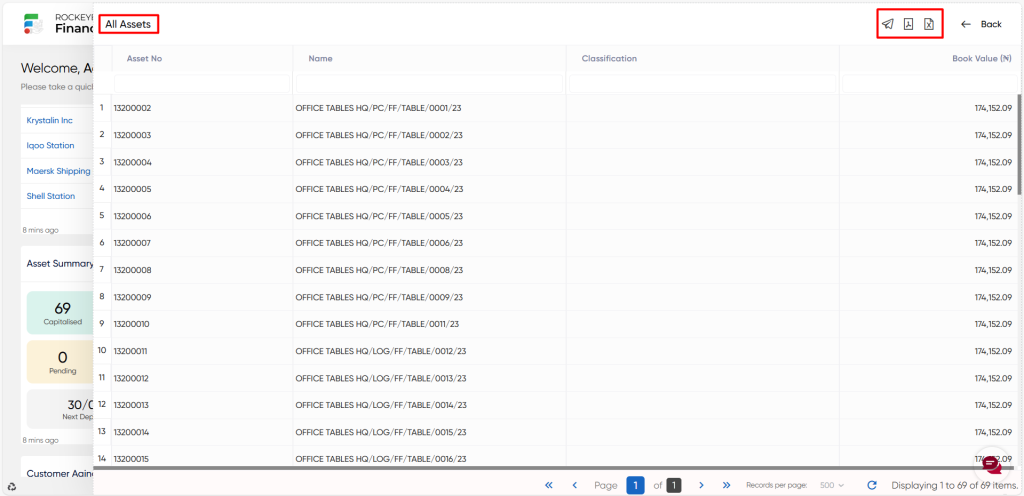
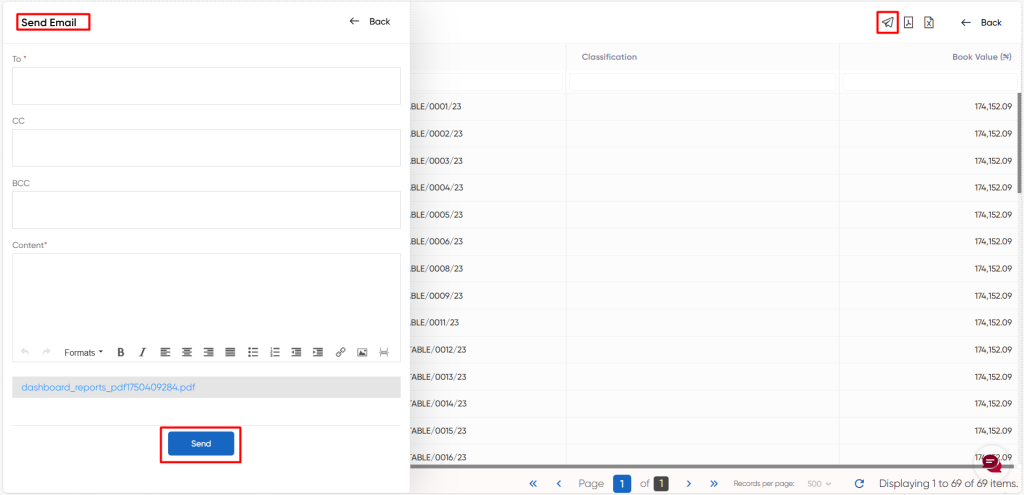
- When a user clicks the mail icon, a popup will appear, prompting the user to select between PDF, CSV, or both options. Upon choosing any of these options, the user will be directed to a page to send the selected PDF or CSV file via email.
Loan – upcoming Payments:
Within the Finas dashboard, the Loan – Upcoming Payments section provides useful information about upcoming loan installments. This section shows predetermined timeframes, such as 7 days, 15 days, 30 days, and 180 days, as well as the corresponding payment amounts. The displayed amounts dynamically adjust to reflect the impending payments within these specified time intervals.
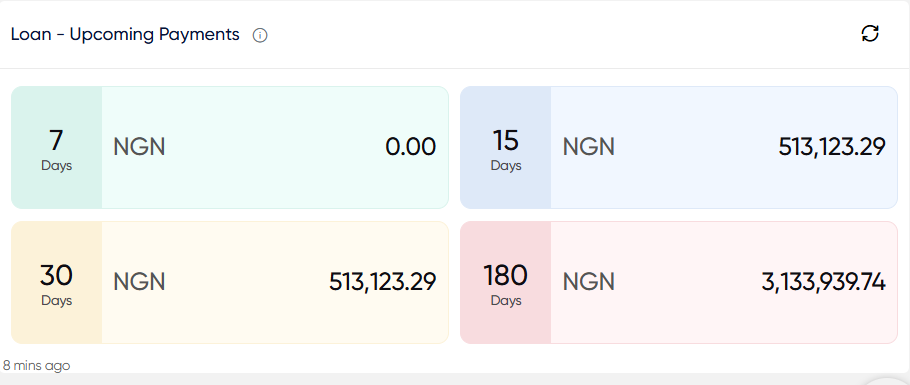
- Users will be able to use the refresh icon. When users click the refresh icon, the entire Loan – Upcoming Payments section will be updated.
Bank – Day Book:
The Bank – Day Book section in the Finas dashboard provides a detailed log of daily bank activities and balances. This section includes important information such as the Opening Balance, Amount Received Today, Amount Paid Today, and Closing Balance.
Moreover, this section encompasses three distinctive columns:
- The top 5 received transactions comprise the Bank name along with the corresponding transaction amount.
- The top 5 Paid transactions comprise the Bank name along with the corresponding transaction amount.
- Negative Balance: uncovers instances where a bank account holds a negative balance. Each entry specifies the Bank name along with the deficit amount.
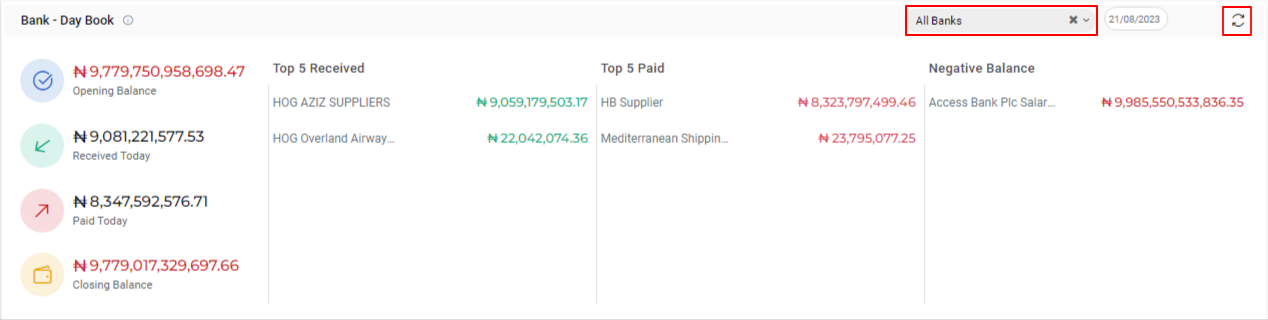
- User will be able to access the 2 dropdowns Bank selection and the date selection.
- Users can opt to view data for specific bank or all banks through dropdown and also pick a specific date, and the data will be displayed up to the chosen date.
- Users will be able to use the refresh icon. When users click the refresh icon, the entire Bank – Day Book section will be updated.
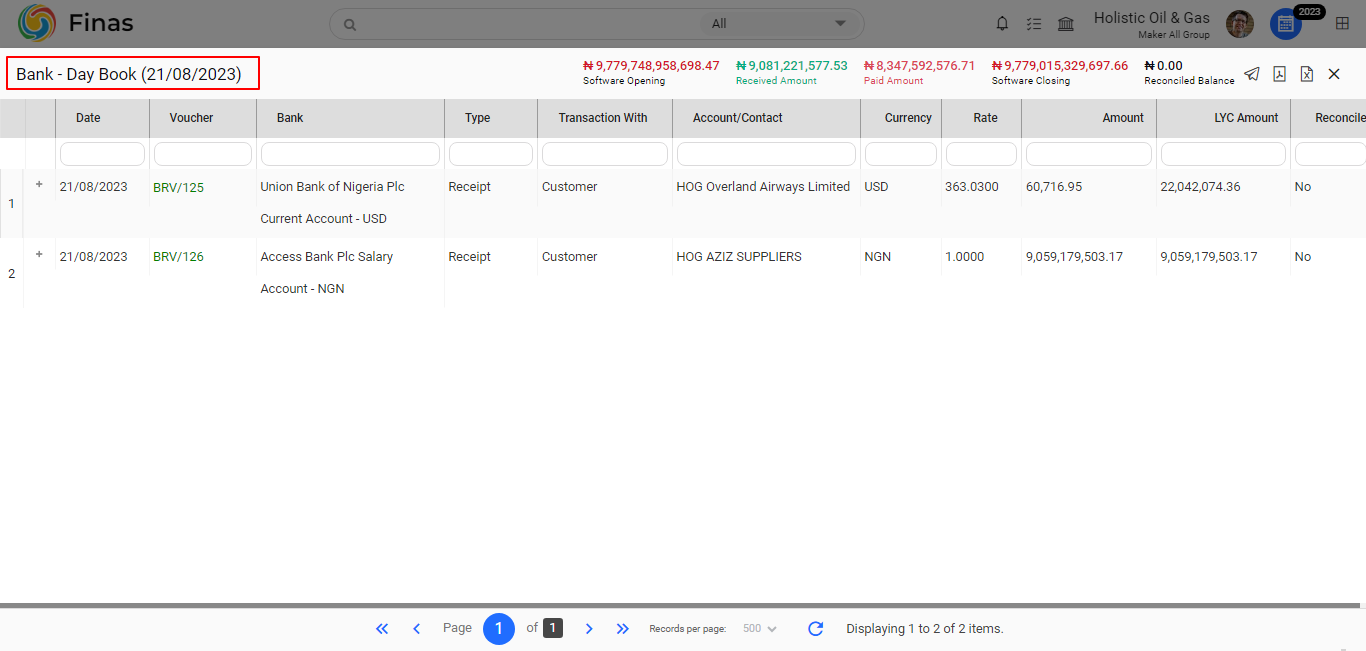
- Users will be able to click on the Received today and paid today fields of Bank – Day Book to show the particular data with specific fields such as Date, Voucher, Bank, Type, Transaction with, Account / contact, Currency, Rate, LYC amount, Reconciled.
- User will be able to see the software opening, Received amount, Paid amount, Software closing, Reconciled Balance in the menu bar.

- When a user clicks the mail icon, a popup will appear, prompting the user to select between PDF, CSV, or both options. Upon choosing any of these options, the user will be directed to a page to send the selected PDF or CSV file via email.
