Balances
Total Balance:
The “Total Balances” section within the “Balances” module of the Financial Accounting Dashboard provides an overall overview of financial balances. This section is distinguished by the presence of two line graphs. This segment stands out due to the inclusion of two distinct line graphs, with one dedicated to each month.
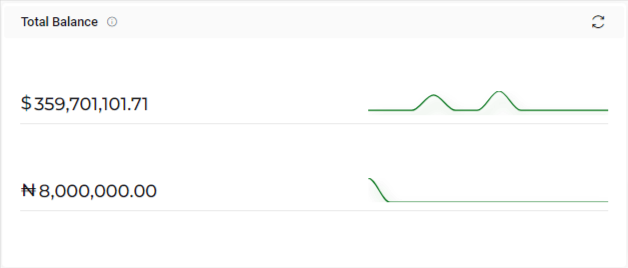
- The first graph shows balances in USD (U.S. Dollars), followed by a graph showing balances in Naira (Nigerian Naira).
- By selecting certain balance data points, users can gain access to detailed information.
- This collection includes bank names and provides a detailed overview of cumulative credit and debit transactions obtained from the book list.
- Users will be able to use the refresh icon. When users click the refresh icon, the entire Total Balances section will be updated.
- The user will be able to click on the amounts to retrieve a list of data with the Book list name associated with the amount.

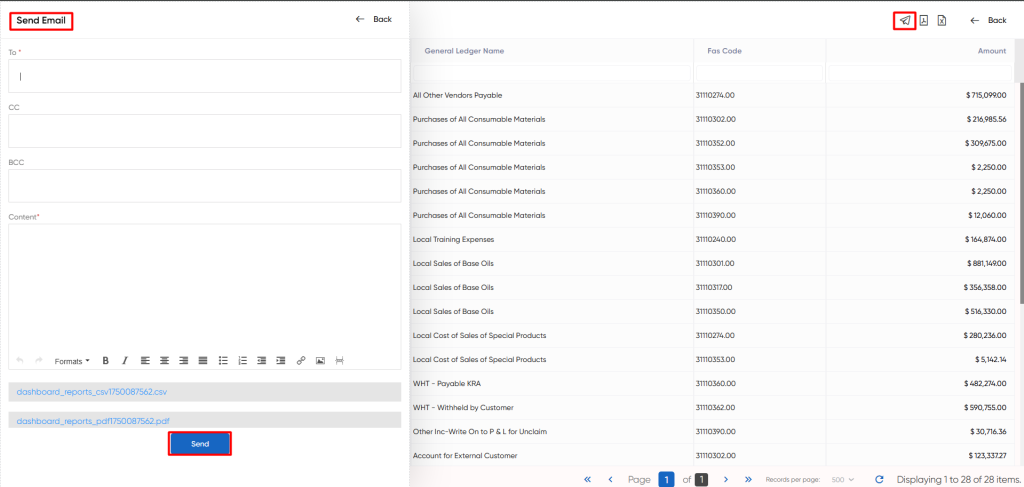
- When a user clicks the mail icon, a popup will appear, prompting the user to select between PDF, CSV, or both options. Upon choosing any of these options, the user will be directed to a page to send the selected PDF or CSV file via email.

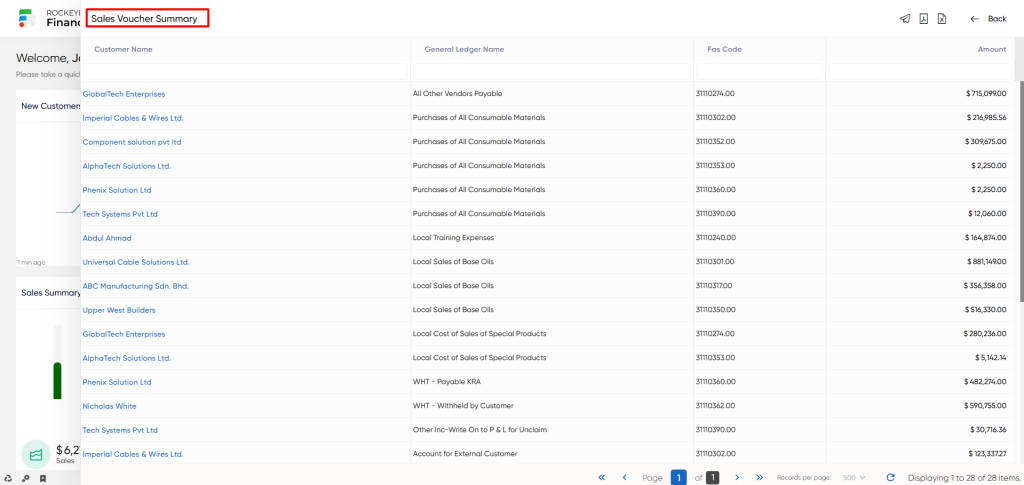
Summary:
The “Summary” segment in the “Balances” module of the Finas dashboard provides a concise overview of various financial transactions. It displays the amount and value of Sales Vouchers, Credit Notes, Receivable Vouchers, and Debit Notes. This brief overview provides customers with a quick understanding of transactional activities while also allowing for further research into single transactions for a more complete understanding.
- Users will be able to use the refresh icon. When users click the refresh icon, the entire Summary section will be updated.
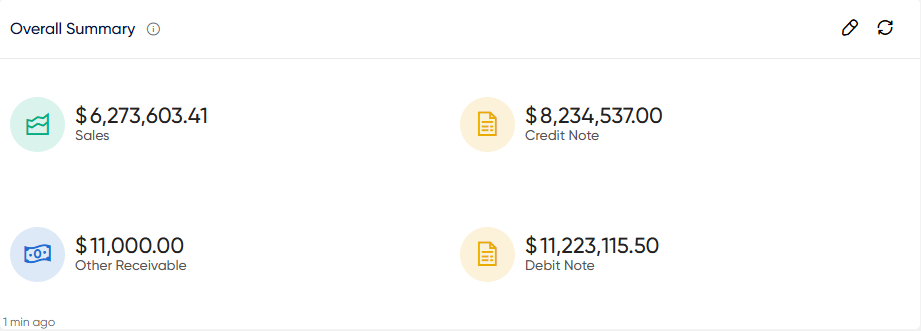
- Users will be able to click on these Sales Vouchers, Credit Notes, Receivable Vouchers, and Debit Notes to get the specific information which include client names, GL names, Fas codes, invoice numbers, and matching amounts.
- When a user clicks the mail icon, a popup will appear, prompting the user to select between PDF, CSV, or both options. Upon choosing any of these options, the user will be directed to a page to send the selected PDF or CSV file via email.
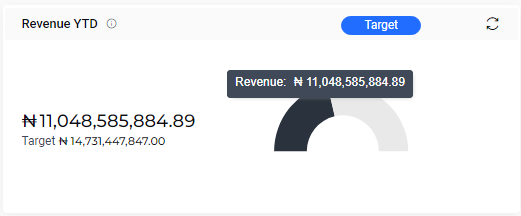
Revenue YTD:
The “Revenue YTD” part of the Finas dashboard’s “Balances” module displays the Year-to-Date revenue amount as well as the associated Target Amount.
- Users will be able to use the refresh icon. When users click the refresh icon, the entire Revenue YTD section will be updated.

- The user can move the pointer around a semi-circle graph. The graphs show the revenue and the value of revenue, as well as the target and the amount of target.
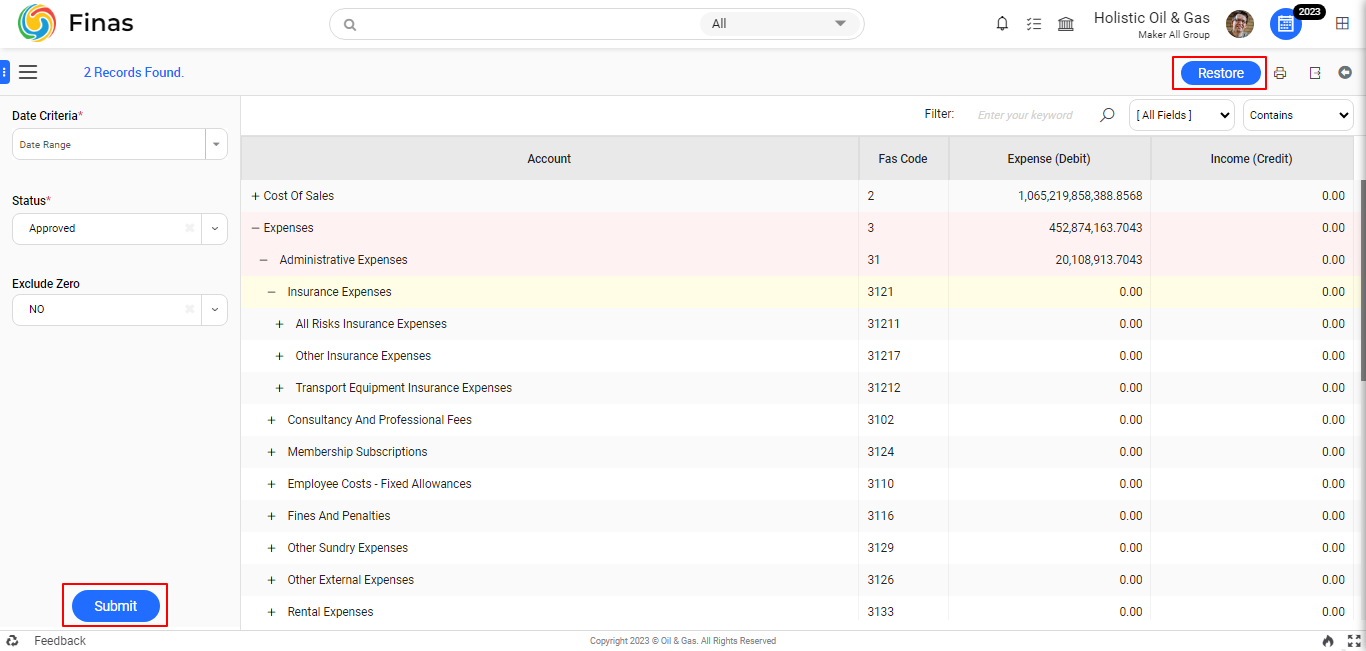
- Users are presented with four fields when they click on the Revenue YTD amount: Account, FAS Code, Expense (debit), and Income (credit).
- Additionally, users can use the search functionality. They can search using dropdown options. Users can do searches using a variety of selectable options, including column names, and apply precise search criteria such as “begins with,” “ends with,” and others.
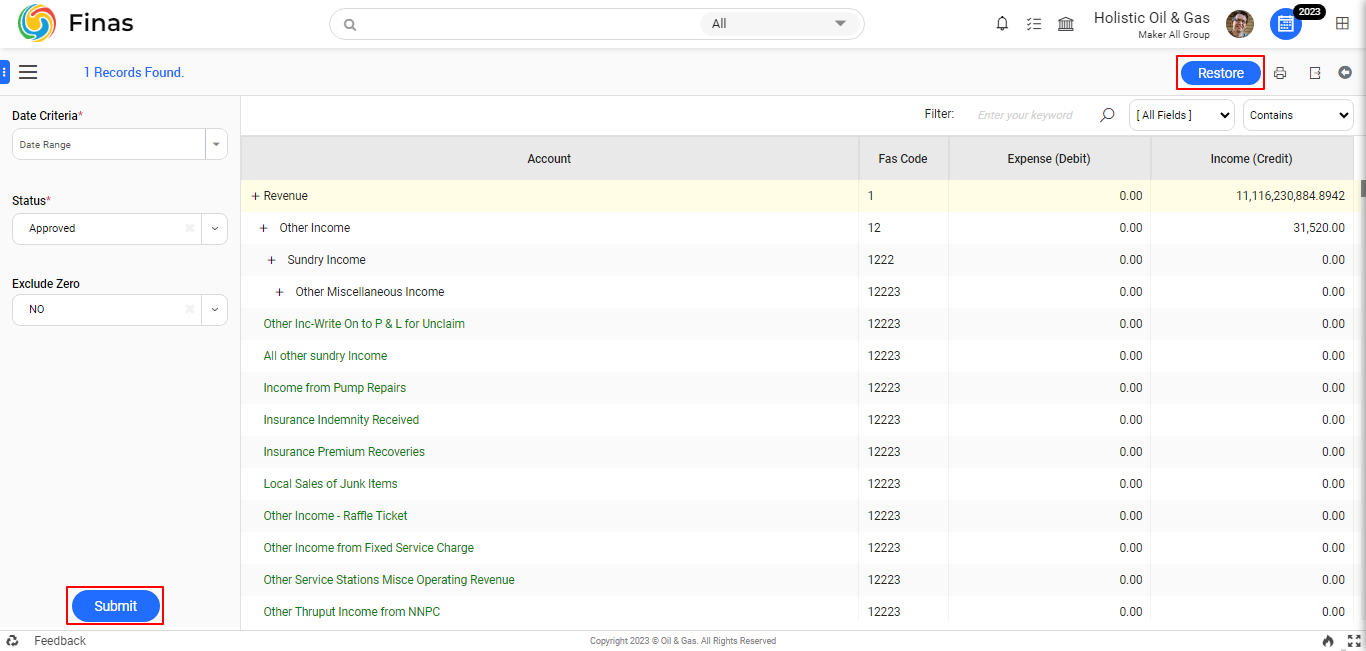
- Users can filter the data by Date criteria like monthly or quarterly or Range and selecting that particular month / range to get the specified data.
- Users will be able to click the target button to set the name and the target amount.
- Users can restore data by clicking the Restore Button. By clicking on the export icon, they can also export the data in CSV format.
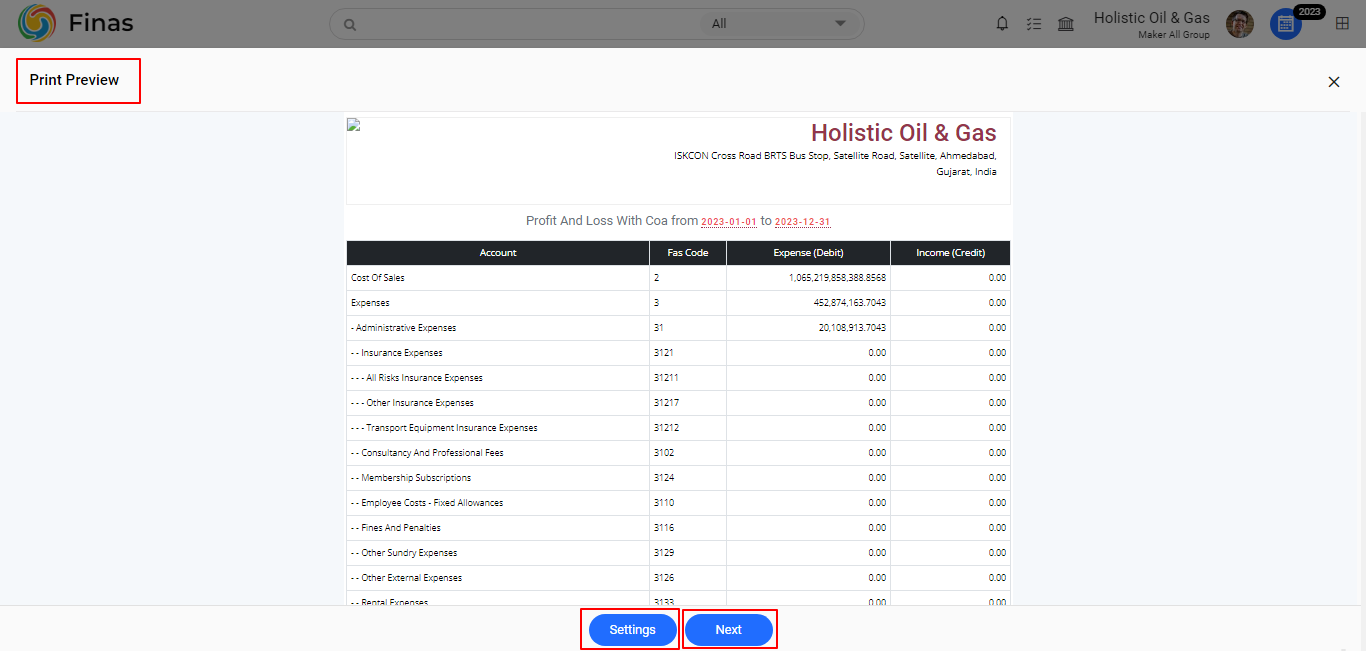
- Users can also print or save the data by clicking on the print icon.
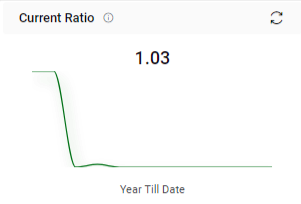
Current Ratio:
The “Current Ratio” in the Finas dashboard’s “Balances” module displays a line graph illustrating the ratio’s growth from January to December, spanning the year-to-date period. When the mouse cursor is moved over the line graph, the associated month’s name and monthly ratio are displayed.
- Users will be able to use the refresh icon. When users click the refresh icon, the entire Current Ratio section will be updated.
Profit and loss:
The “Profit and Loss” part of the Finas dashboard’s “Balances” module includes a pie chart graph that depicts the distribution of income and expenses. The graph displays the amounts for Income and Expenses, offering an overview of the financial performance and the relationship between the two categories.
- Users will be able to use the refresh icon. When users click the refresh icon, the entire Profit and Loss section will be updated.

Total Revenue:
The “Total Revenue” part of the Finas dashboard’s “Balances” module provides a thorough overview of revenue-related financial data. This includes the sales figure, other income and loss figures, and a visual representation of the distribution. Furthermore, the part includes the entire income amount, giving a complete picture of the organization’s earnings.
- Users will be able to use the refresh icon. When users click the refresh icon, the entire Total Revenue section will be updated.
- The user can move the pointer around a graph. The graphs show the revenue and the value of revenue

- Users are presented with four fields when they click on the sales, other income and amp loss: Account, FAS Code, Expense (debit), and Income (credit).
- Additionally, users can use the search functionality. They can search using dropdown options. Users can do searches using a variety of selectable options, including column names, and apply precise search criteria such as “begins with,” “ends with,” and others.
- Users can filter the data by Date criteria like monthly or quarterly or Range and selecting that particular month / range to get the specified data.
- Users can restore data by clicking the Restore Button. By clicking on the export icon, they can also export the data in CSV format.
- Users can also print or save the data by clicking on the print icon.
Total Cost:
The “Total Cost” component of the Finas dashboard’s “Balances” module provides a complete overview of financial data connected to costs. T This includes the Cost of Sales and Expenses figures, as well as a graphic graph depicting the distribution of the Cost of Sales, Expenses, and overall cost. This section contains useful information on the organization’s expenditures, which may be used to evaluate cost structures and financial performance.
- Users will be able to use the refresh icon. When users click the refresh icon, the entire Total Cost section will be updated.

- The user can move the pointer around a graph. The graph shows the Cost of Sales and Expenses figures.
- Users can filter the data by Date criteria like monthly or quarterly or Range and selecting that particular month / range to get the specified data.
- Users are presented with four fields when they click on the Cost of Sales and Expenses: Account, FAS Code, Expense (debit), and Income (credit).
- Additionally, users can use the search functionality. They can search using dropdown options. Users can do searches using a variety of selectable options, including column names, and apply precise search criteria such as “begins with,” “ends with,” and others.
- Users can restore data by clicking the Restore Button. By clicking on the export icon, they can also export the data in CSV format.
- Users can also print or save the data by clicking on the print icon.
Bank Balance:
The “Bank Balance” part of the Finas dashboard’s “Balances” module provides a comprehensive view of the organization’s financial condition in relation to bank accounts. This contains the Bank Opening value, which represents the account’s starting balance.
- The section also includes graphical representations and numerical figures for the following elements: Bank Receipt, Bank Payment, Current amount.

- The Bank Receipt indicates the amount of money placed into the bank account over a particular amount of time.
- The Bank Payment denotes the amount of money withdrawn from a bank account during a specified time period.
- The Current amount section also displays the current balance of the bank account after accounting for all incoming and outgoing activities.
- Users will be able to use the refresh icon. When users click the refresh icon, the entire Bank Balance section will be updated.
- Users are presented with 15 fields when they click on the Bank Opening and the Current Balance : Bank Book Name, Print Name, code, chart of account, Account Number, Account type, Branch number, Swift code, currency, op.Balance, Bal.type, software Balance, software balance type, Bank balance, Bank balance type.
- Users can also use the search functionality within the Bank opening and the current Balance. They can conduct a search by selecting the filter icon. Users can conduct searches using a variety of parameters, including column names.
- Users are presented with 8 fields when they click on the Bank Receipt and Bank Payment: date, vuch.no, Trans.type, code, account, desc, vuch.amount, Recon.status
- Users can filter the data by Date criteria like monthly or quarterly or Range and selecting that particular month / range to get the specified data.
- Users can restore data by clicking the Restore Button. By clicking on the export icon, they can also export the data in CSV format.
- Users can also print or save the data by clicking on the print icon.
Bank payment status summary:
The “Bank Payment Status Summary” part of the Finas dashboard’s “Balances” module gives a concise overview of the current status of bank payments. This section displays the number and value of payments in the “Pending” or “Approved” state.
- Users will be able to use the refresh icon. When users click the refresh icon, the entire Bank Payment Status Summary section will be updated.

- Users will be able to click on these Pending or Approved to get the specific information which include vchr.No, vchr.Date, From Name, To Name, Amount.
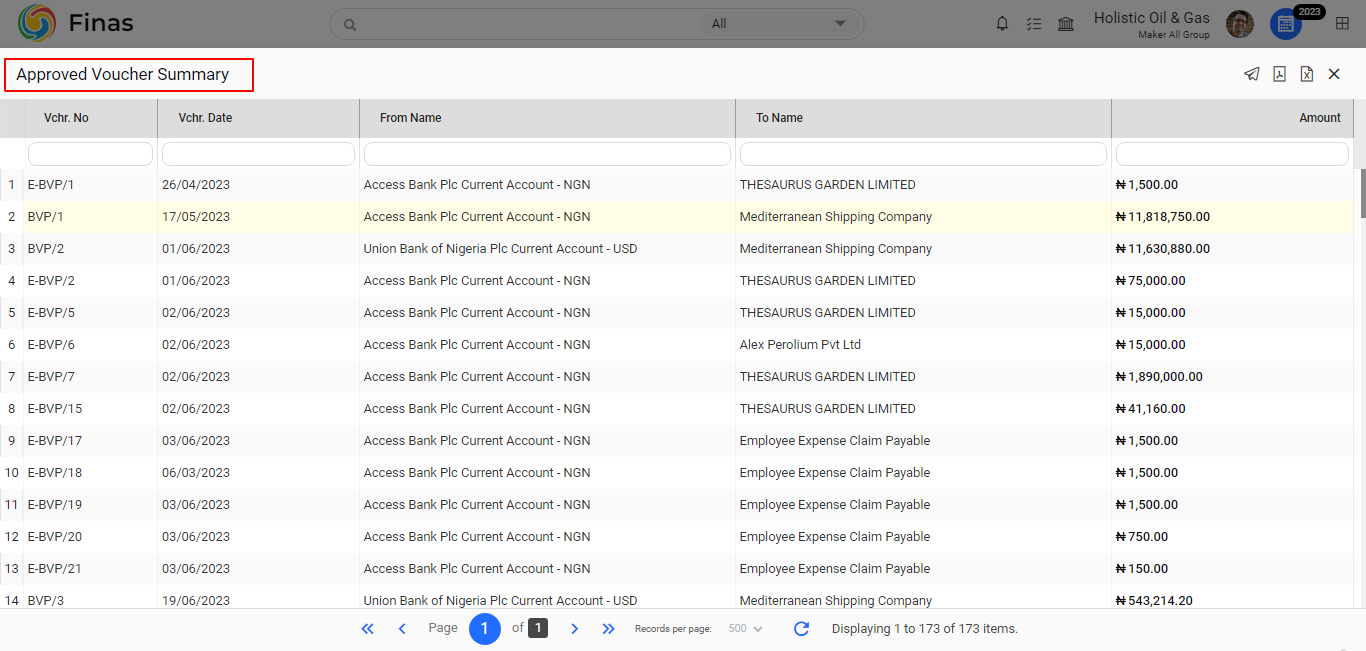
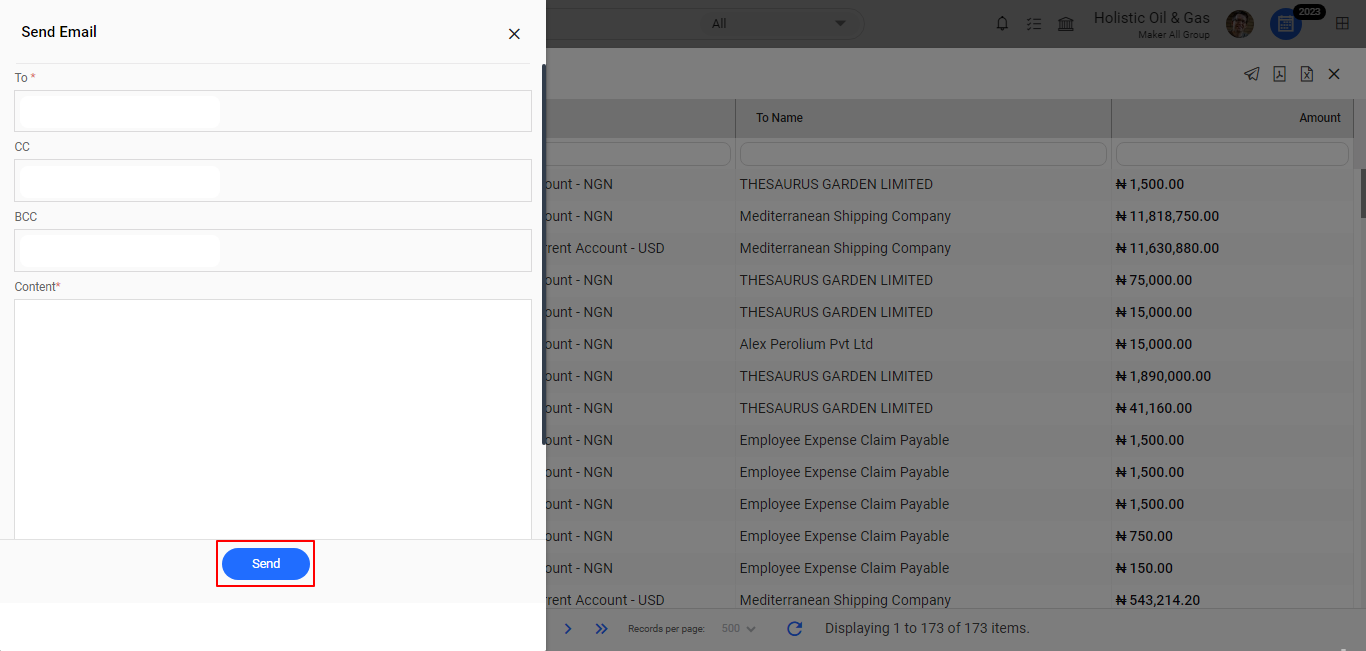
- When a user clicks the mail icon, a popup will appear, prompting the user to select between PDF, CSV, or both options. Upon choosing any of these options, the user will be directed to a page to send the selected PDF or CSV file via email.
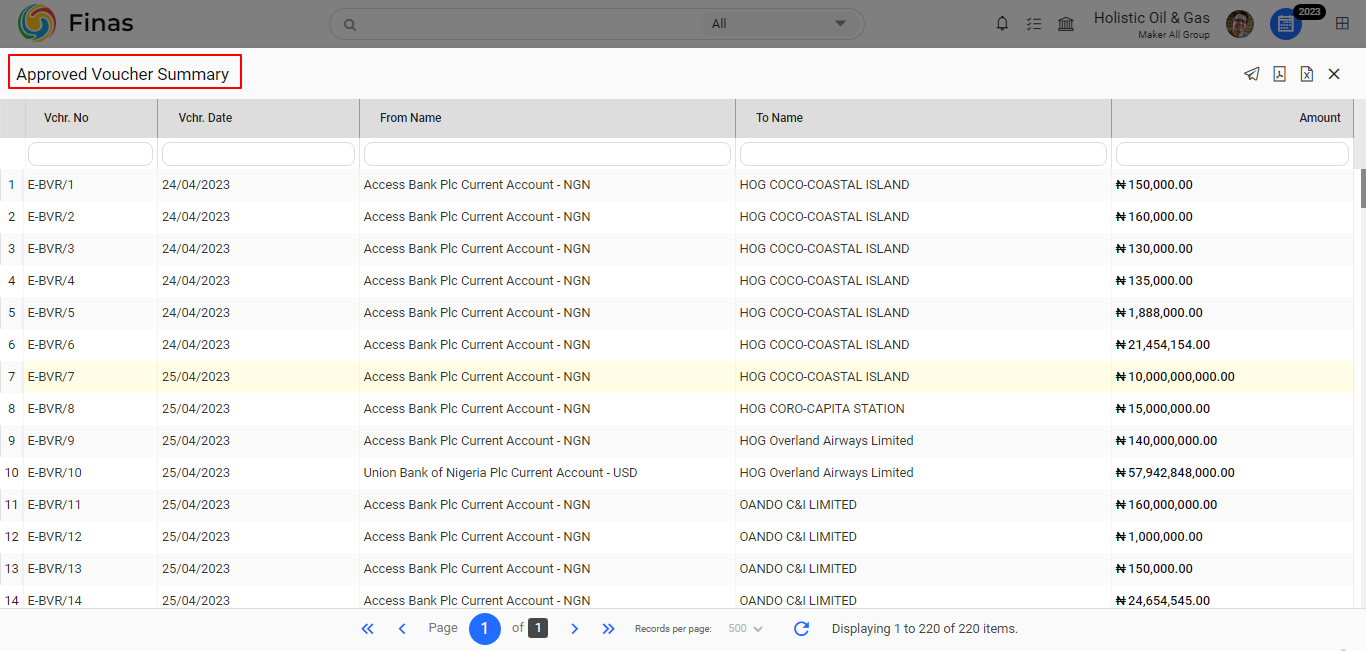
Bank Receipt status summary:
The “Bank Receipt Status Summary” part of the Finas dashboard’s “Balances” module gives a concise overview of the current status of bank receipts. This section displays the number and value of receipts in the “Pending” or “Approved” state.
- Users will be able to use the refresh icon. When users click the refresh icon, the entire Bank Receipt Status Summary section will be updated.
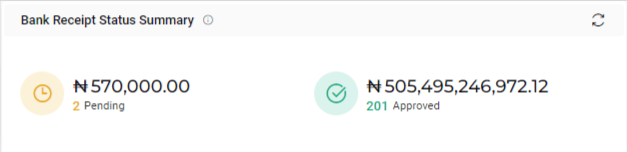
- Users will be able to click on these Pending or Approved to get the specific information which include vchr.No, vchr.Date, From Name, To Name, Amount.
- When a user clicks the mail icon, a popup will appear, prompting the user to select between PDF, CSV, or both options. Upon choosing any of these options, the user will be directed to a page to send the selected PDF or CSV file via email.

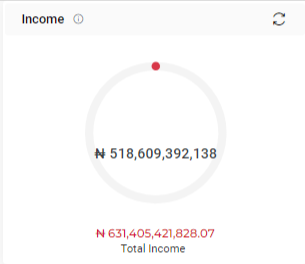
Income:
The “Income” part of the Finas dashboard’s “Balances” module displays a visual depiction of income in the form of a pie chart graph. This diagram depicts the distribution of income sources. Beneath the graph, the section provides the total income value, giving a concise overview of the organization’s earnings from diverse sources.
- Users will be able to use the refresh icon. When users click the refresh icon, the entire Income section will be updated.
Earning and Expenses:
The “Earnings and Expenses” part of the Finas dashboard’s “Balances” module provides insights into the financial dynamics of earnings and expenses. From January to December, this section includes graphical representations of Earnings, Expenses, and Net Value.
- The section contains three radio buttons, each of which corresponds to a different graph view: Earnings, Expenses, and Net Value.
- The graph displays the selected data by default. To view the specific graph they’re interested in, users can choose between these radio buttons.
- When a radio button is selected, the related graph is displayed, while deselecting all radio buttons causes the graph to disappear from view.
- This dynamic feature helps users to focus on the specific region of financial performance they want to examine, improving their understanding of the data.
- Users will be able to use the refresh icon. When users click the refresh icon, the entire Earnings and Expenses section will be updated.

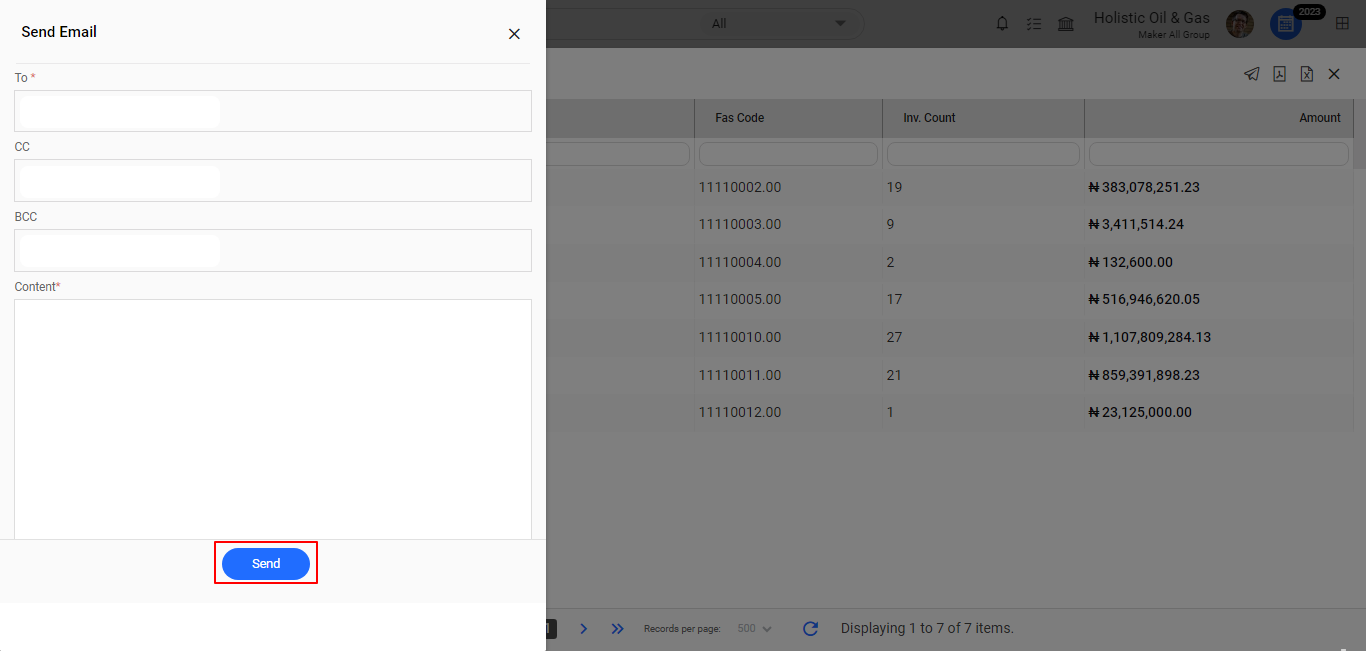
Sales Status Summary:
The “Sales Status Summary” section within the “Balances” module of the Finas dashboard provides a concise overview of the status of sales transactions. This section includes the count and total amount of sales transactions categorized as “Pending” and “Approved.”
- Users will be able to use the refresh icon. When users click the refresh icon, the entire Sales Status Summary section will be updated.
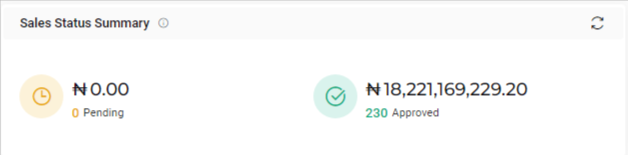
- Users will be able to click on the sales amount of Pending or Approved to get the specific information which include Customer Name, Fas Code, Inv. count, Amount.
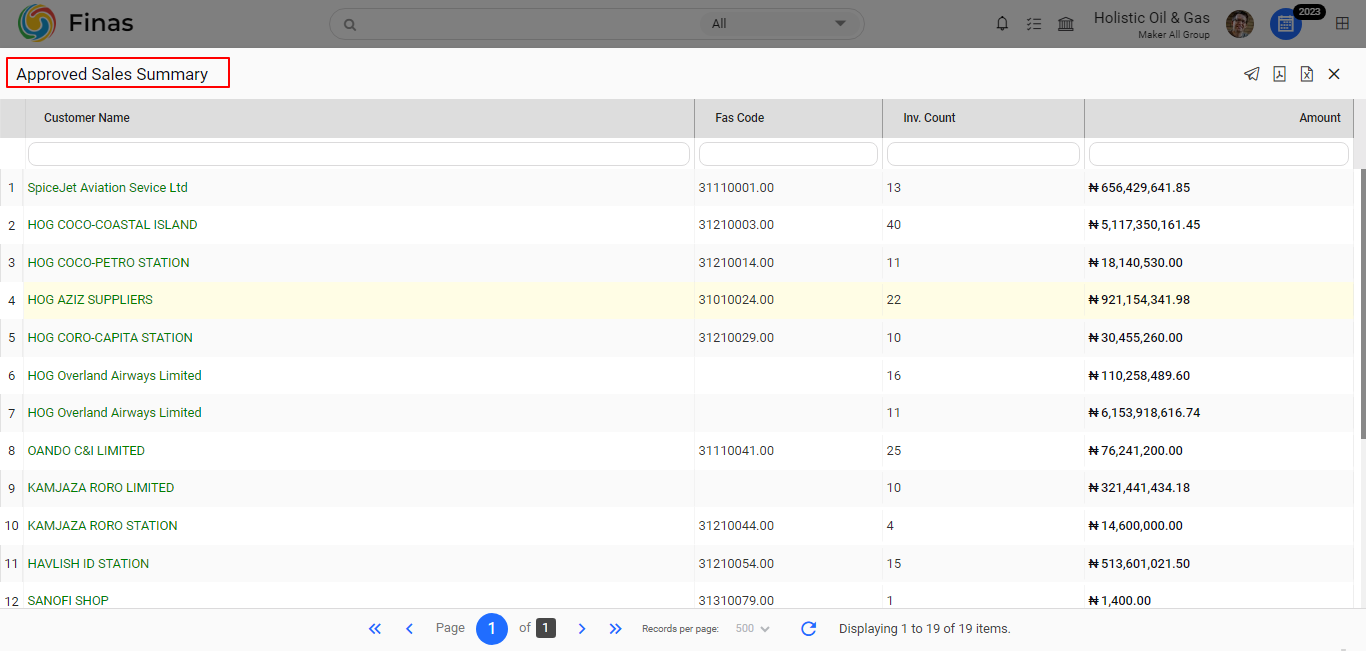
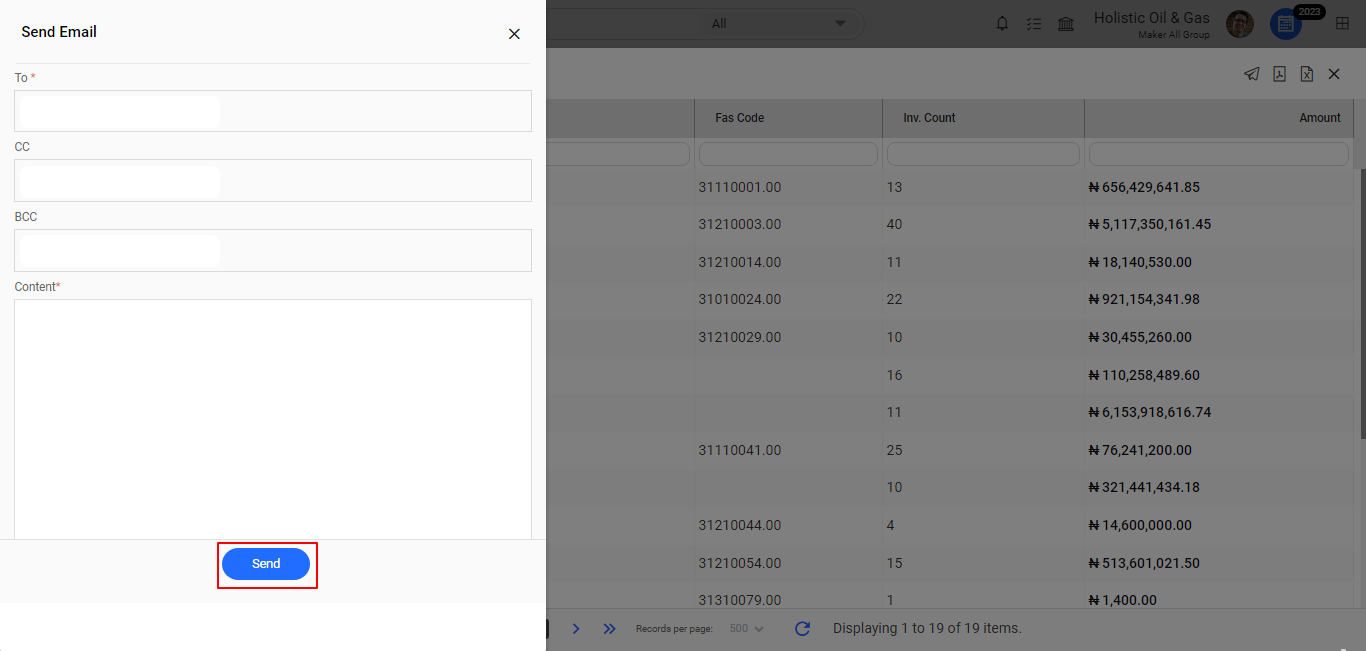
- When a user clicks the mail icon, a popup will appear, prompting the user to select between PDF, CSV, or both options. Upon choosing any of these options, the user will be directed to a page to send the selected PDF or CSV file via email.
Purchase status summary:
The “Purchase Status Summary” section within the “Balances” module of the Finas dashboard provides a complete overview of the status of purchase transactions. This section includes the count and total amount of purchase transactions categorized as “Pending” and “Approved.”
- Users will be able to use the refresh icon. When users click the refresh icon, the entire Purchase Status Summary section will be updated.
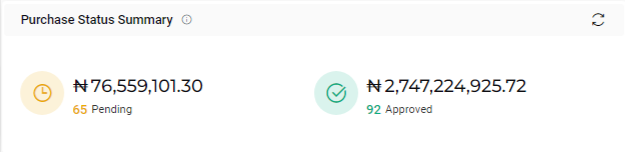
- Users will be able to click on the purchase amount of Pending or Approved to get the specific information which include Customer Name, Fas Code, Inv. count, Amount.
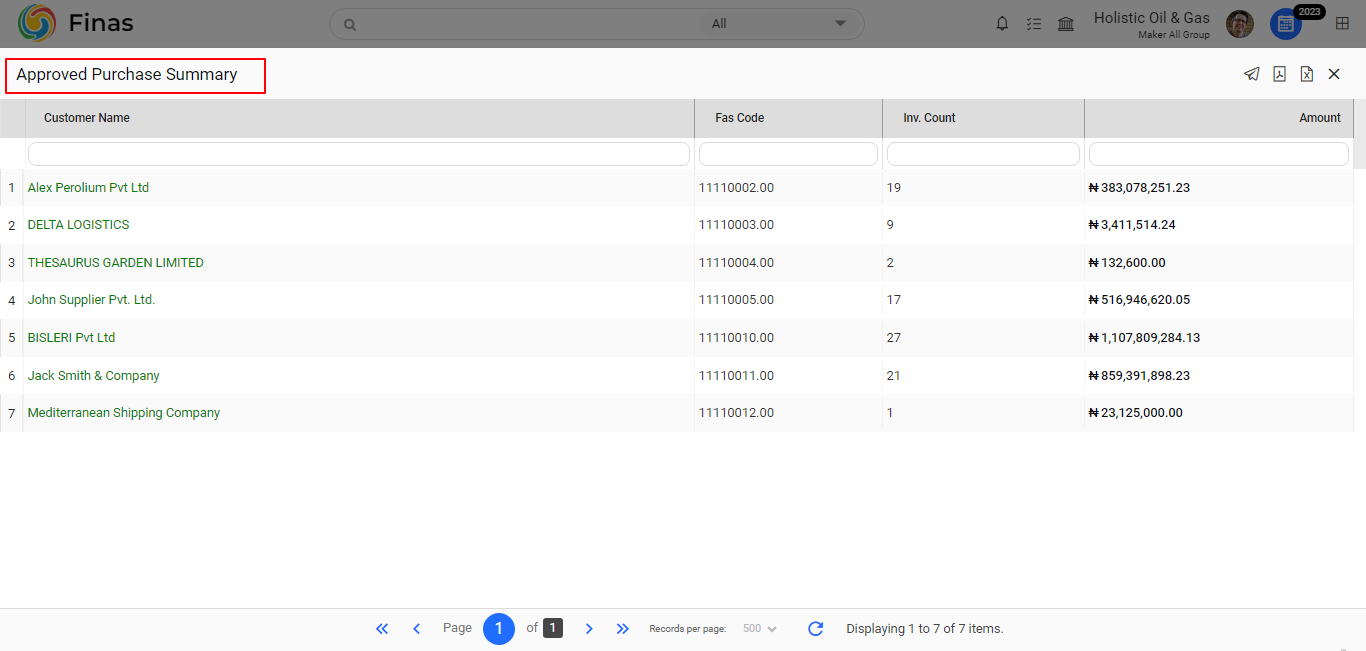
- When a user clicks the mail icon, a popup will appear, prompting the user to select between PDF, CSV, or both options. Upon choosing any of these options, the user will be directed to a page to send the selected PDF or CSV file via email.
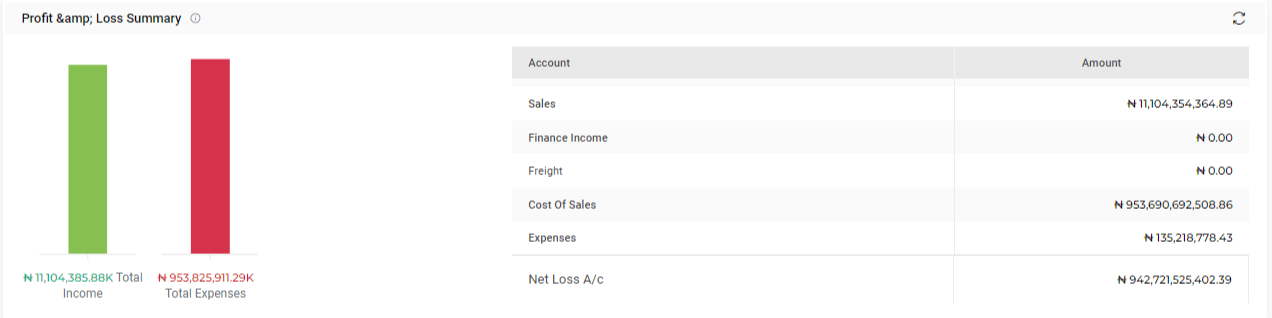
Profit and amp; Loss summary:
The “Profit and amp; Loss Summary” section within the “Balances” module of the Finas dashboard provides a comprehensive overview of the organization’s financial performance. This section features bar graphs that visualize the amounts of Total Income and Total Expenses, offering a clear comparison between revenue and costs.
- Users will be able to use the refresh icon. When users click the refresh icon, the entire Profit and amp; Loss Summary section will be updated.
- Additionally, the section contains a table featuring two columns: “Account” and “Amount.” The table encompasses various accounts, each associated with its respective amount.
- These accounts consist of Sales, Finas Income, Freight, Cost of Sales, and Expenses. Towards the end of the table, there is an entry for “Net Loss A/C,” indicating the overall amount of net loss incurred.
Balance Sheet:
The “Balance Sheet” part of the Finas dashboard’s “Balances” module provides a complete overview of the organization’s financial status. This part includes a table with three separate columns: Account, Asset Amount, and Liability Amount.
- Users will be able to choose the desired month from the dropdown for getting the data. System considered the desired selected month as the current month. .
- Users will be able to use the refresh icon. When users click the refresh icon, the entire Balance Sheet will be updated.
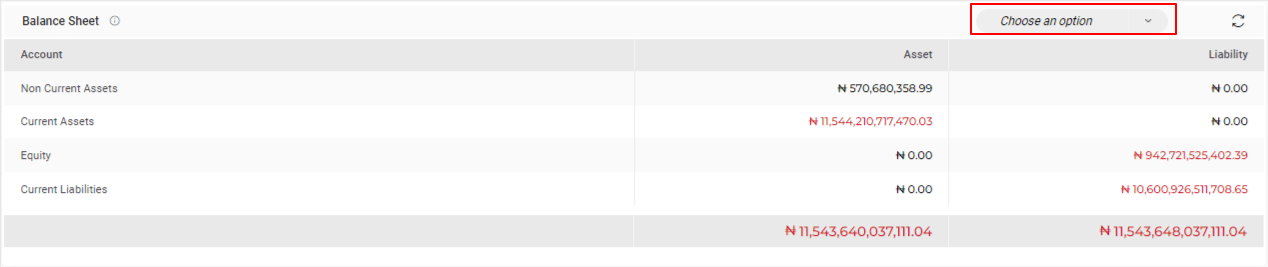
- Users can get a complete list of data by clicking on the “Balance Sheet,” which includes columns such as Account, Fas Code, Asset Amount, and Liability Amount.
- Users can filter the data by Date criteria like monthly or quarterly or Range and selecting that particular month / range to get the specified data.
- Users can restore data by clicking the Restore Button. By clicking on the export icon, they can also export the data in CSV format.
- Users can also print or save the data by clicking on the print icon.
Due from Customers:
The “Due from Customers” section within the “Balances” module of the Finas dashboard provides an overview of outstanding amounts owed by customers. This section displays both the count and the cumulative amount of due and overdue customer accounts.
- Users will be able to use the refresh icon. When users click the refresh icon, the entire Due from Customers section will be updated.
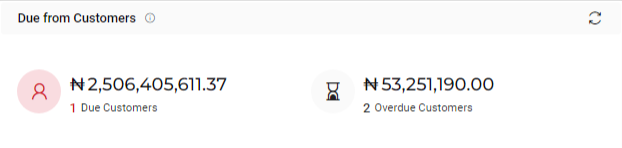
- Users will be able to click on the amount of Due from Customers to get the specific data which includes Name, Inv. count, Amount.


- When a user clicks the mail icon, a popup will appear, prompting the user to select between PDF, CSV, or both options. Upon choosing any of these options, the user will be directed to a page to send the selected PDF or CSV file via email.
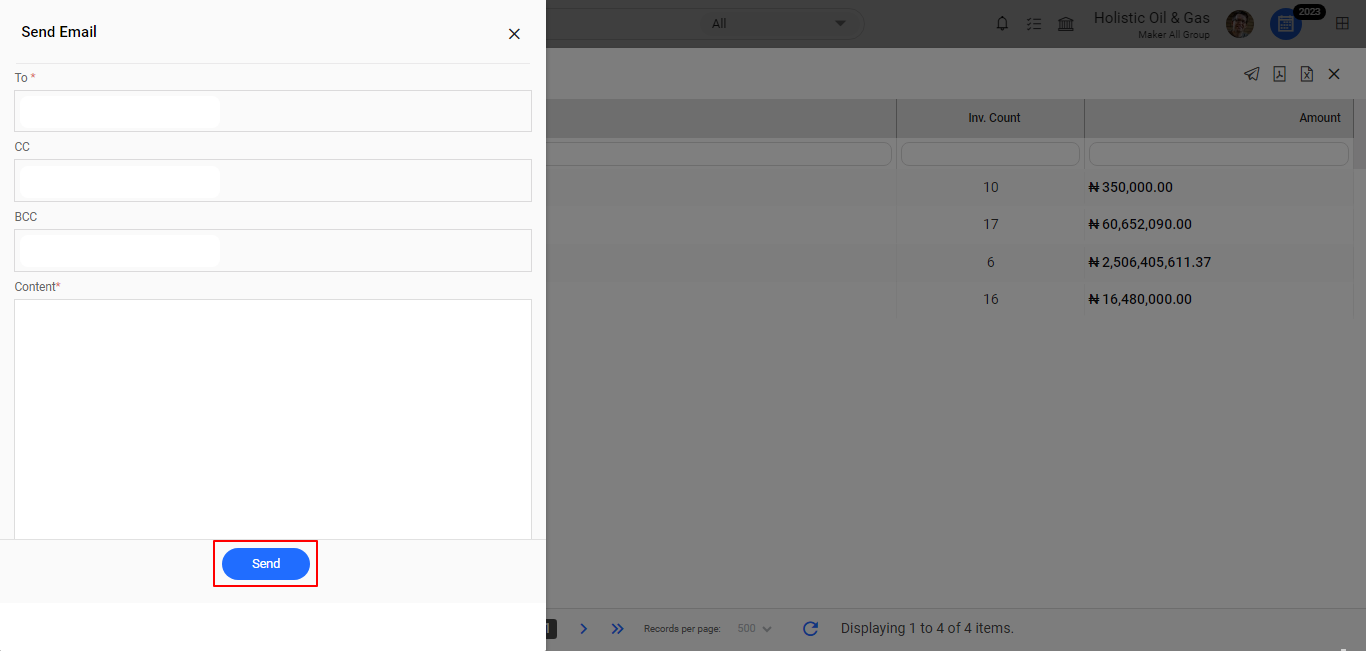
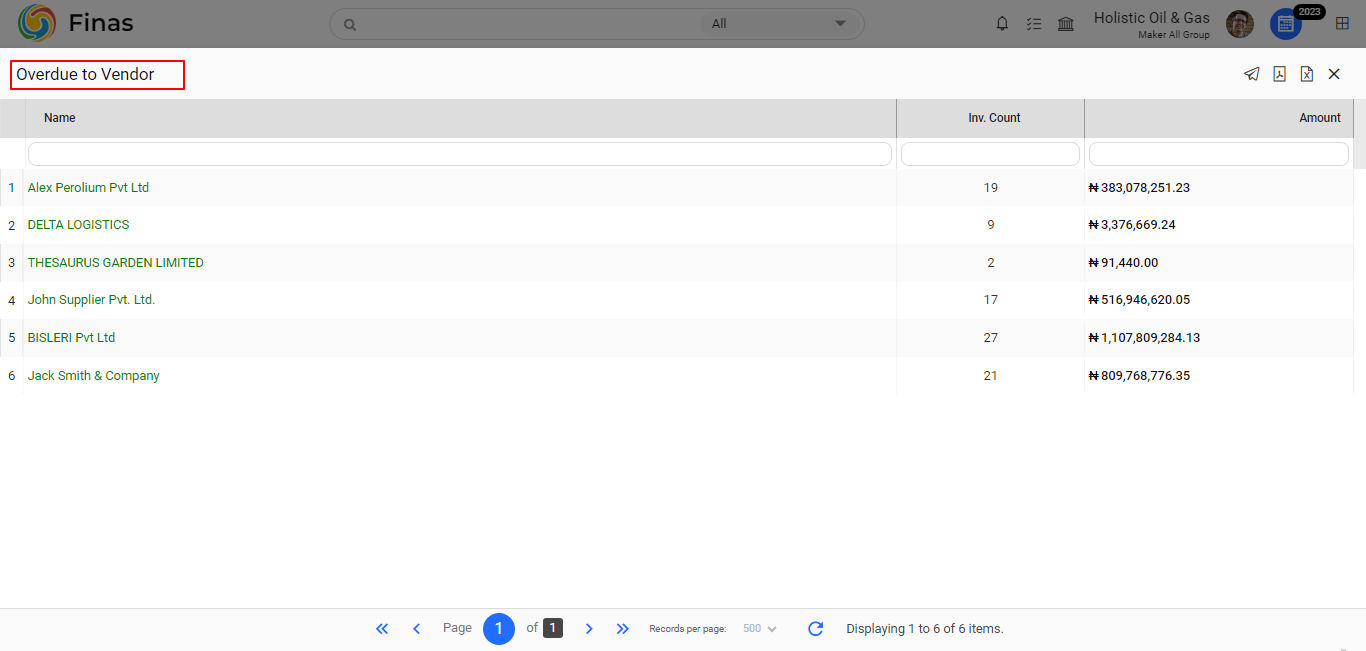
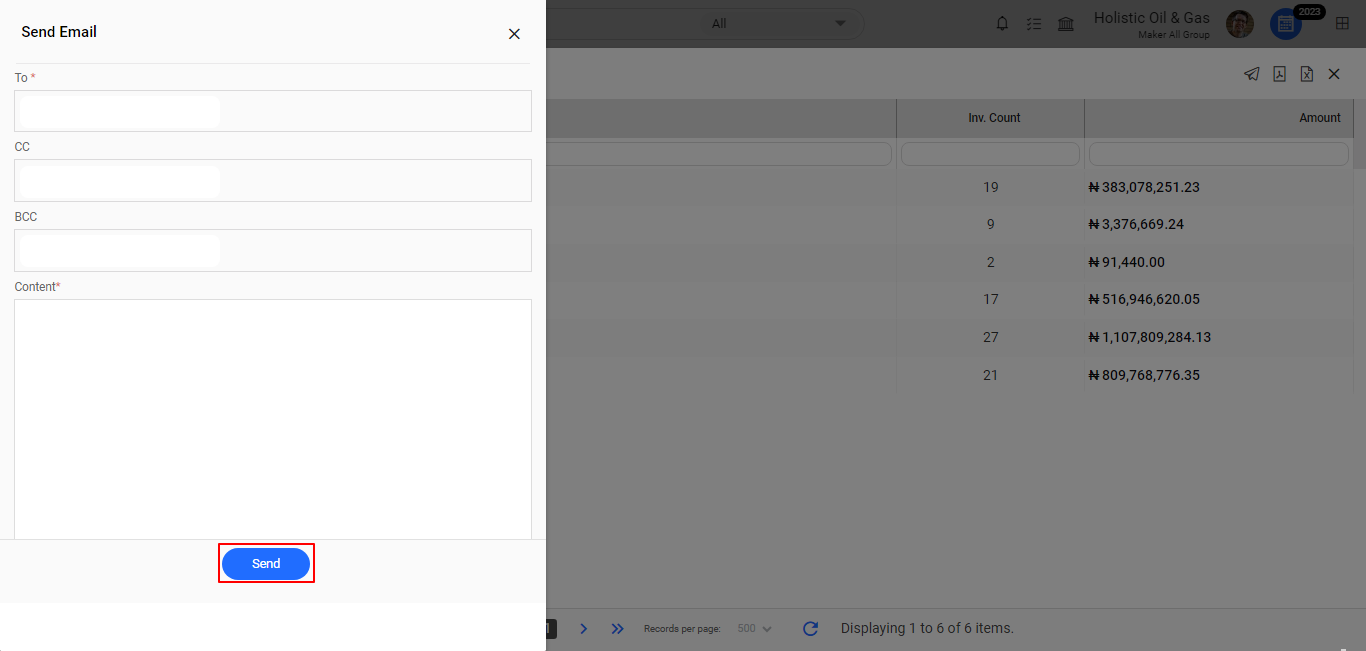
Due to vendors:
The “Due to vendors” section within the “Balances” module of the Finas dashboard provides an overview of outstanding amounts owed by vendors. This section displays both the count and the cumulative amount of due and overdue customer vendors.
- Users will be able to use the refresh icon. When users click the refresh icon, the entire Due to vendors section will be updated.

- Users will be able to click on the amount of Due to vendors to get the specific data which includes Name, Inv. count, Amount.
- When a user clicks the mail icon, a popup will appear, prompting the user to select between PDF, CSV, or both options. Upon choosing any of these options, the user will be directed to a page to send the selected PDF or CSV file via email.
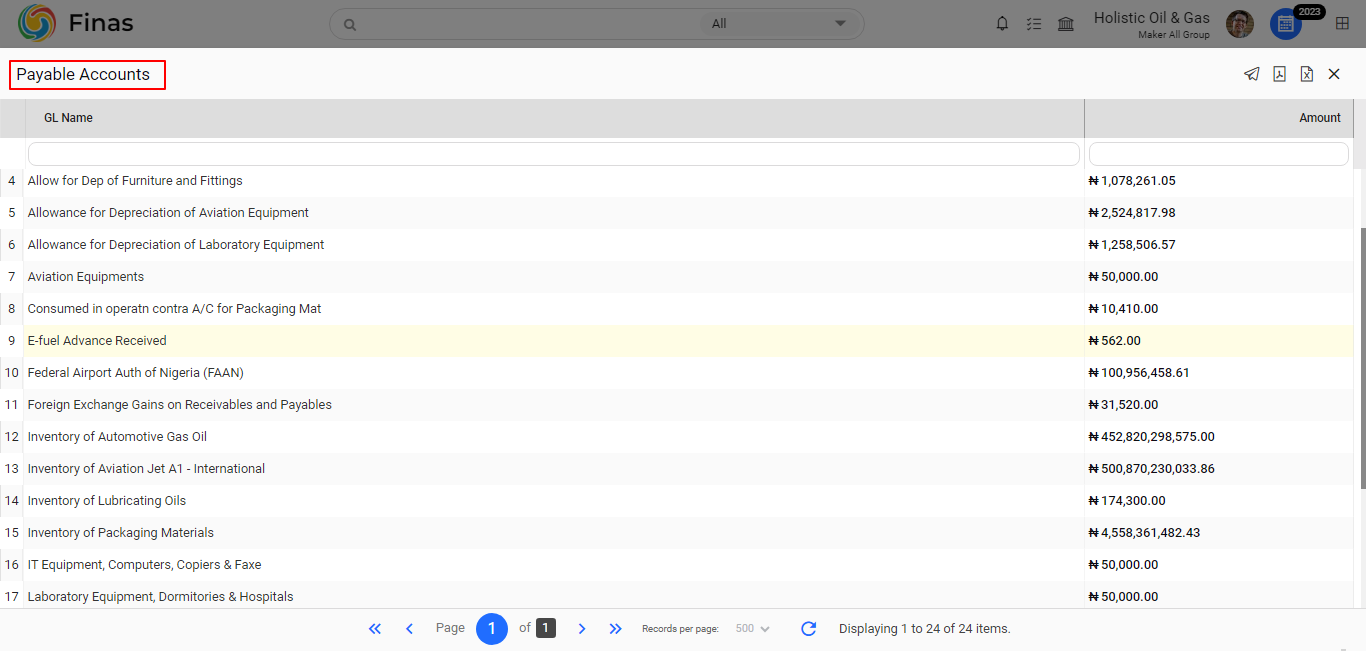
Payable Accounts:
The “Payable Accounts” part of the Finas dashboard’s “Balances” module provides an overview of the number and total amount of Payable Accounts.
- Users will be able to use the refresh icon. When users click the refresh icon, the entire Payable Accounts will be updated.
- Users are able to see a detailed view by clicking on the Payable A/C Count, which provides the General Ledger (GL) Name and related amount.

- When a user clicks the mail icon, a popup will appear, prompting the user to select between PDF, CSV, or both options. Upon choosing any of these options, the user will be directed to a page to send the selected PDF or CSV file via email.
Receivable Accounts:
The “Receivable Accounts” part of the Finas dashboard’s “Balances” module provides an overview of the number and total amount of Receivable Accounts.
- Users will be able to use the refresh icon. When users click the refresh icon, the entire Receivable Accounts will be updated.
- Users are able to see a detailed view by clicking on the Receivable A/C Count, which provides the General Ledger (GL) Name and related amount.


- When a user clicks the mail icon, a popup will appear, prompting the user to select between PDF, CSV, or both options. Upon choosing any of these options, the user will be directed to a page to send the selected PDF or CSV file via email.
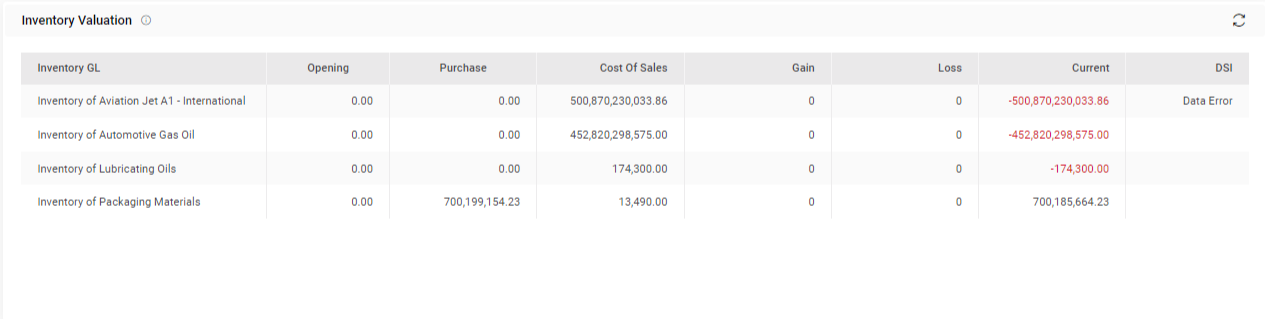
Inventory Valuation:
The “Inventory Valuation” segment in the “Balances” module of the Finas dashboard displays a structured dataset consisting of columns such as Inventory GL, Opening, Purchase, Cost Of Sales, Gain, Loss, Current (depicting negative or positive amount status), and Days Sales of Inventory (DSI).
Inventory valuation refers to the process of determining the financial worth or value of a company’s inventory or stock of goods. It involves assigning a monetary value to the goods held by a business for the purpose of financial reporting, accounting, and decision-making. Inventory valuation is crucial because it impacts a company’s balance sheet, income statement, and profitability analysis.
- Users will be able to use the refresh icon. When users click the refresh icon, the entire Receivable Accounts will be updated.
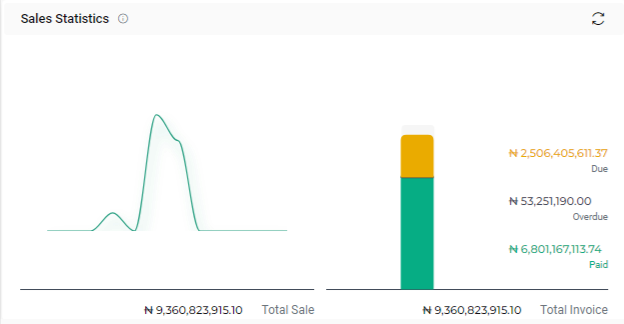
Sales statistics:
The “Sales Statistics” part of the Finas dashboard’s “Balances” module gives a detailed visual representation of sales-related data. This section contains a line graph that depicts the trend of Total Sales as well as the related amounts. It also includes a bar graph indicating Total Invoices and their associated quantities.
Overall, the “Sales Statistics” region provides useful information on the organization’s sales success, outstanding invoices, and payment trends, allowing for more effective decision-making and financial management.
- The Total Invoices bar graph further divides the data into categories such as Due, Overdue, and Paid.
- These categories show how invoices are distributed based on their state. This graphic depiction allows users to rapidly understand the percentage of invoices that are outstanding, overdue, and previously paid.
- Users will be able to use the refresh icon. When users click the refresh icon, the entire Sales Statistics will be updated.
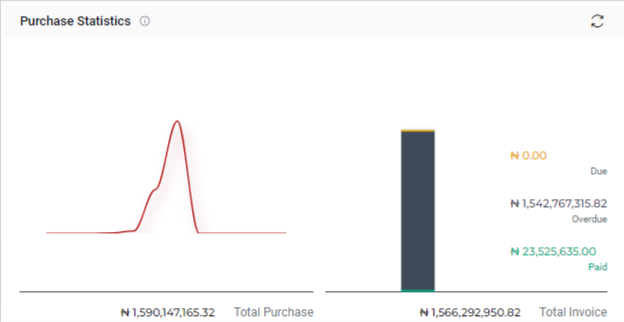
Purchase statistics:
The “Purchase Statistics” part of the Finas dashboard’s “Balances” module gives a detailed visual depiction of purchase-related data. This section contains a line graph that depicts the trend of Total Purchase as well as the associated sums. It also includes a bar graph indicating Total Invoices and their associated quantities.
In conclusion, the “Purchase Statistics” section provides useful information on the organization’s purchasing habits, invoice statuses, and payment trends. This data assists in making informed judgments.
- The Total Invoices bar graph further divides the data into categories such as Due, Overdue, and Paid.
- These categories show how invoices are distributed based on their state. This graphic depiction allows users to rapidly understand the percentage of invoices that are outstanding, overdue, and previously paid.
- Users will be able to use the refresh icon. When users click the refresh icon, the entire Purchase Statistics will be updated.