Smart Dashboard
Introduction/Purpose :
The Smart Dashboard in an Attendance and Visitor Management System serves as a powerful tool, offering real-time insights, operational efficiency, and heightened security. Its purpose is to provide a user-friendly and comprehensive solution that optimizes attendance tracking, visitor management, and overall organizational security.
How to Navigate :
The navigation to record a dashboard in the Attendance Management system typically involves the following steps:
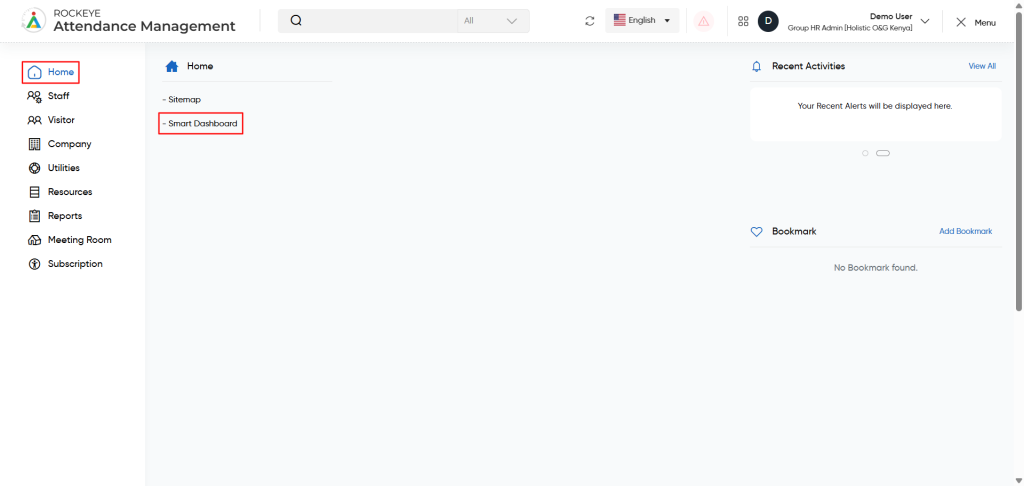
- Click on the main navigation icon, which is located on the top right corner of the screen, and then click on the Home section, which is located on the left side menus on the screen.
- Click on the Smart Dashboard section, which is located under Home. After clicking on this link, you can navigate to the dashboard page.
Smart Dashboard Recordings :
When the user clicks on the Smart dashboard option in the menu then the user will be redirected to the below page.
The dashboard of Attendance and Visitor Managment contains following sections/tabs
- Attendance Summary
- Visitor Summary
- Meeting Summary
Attendance Summary :
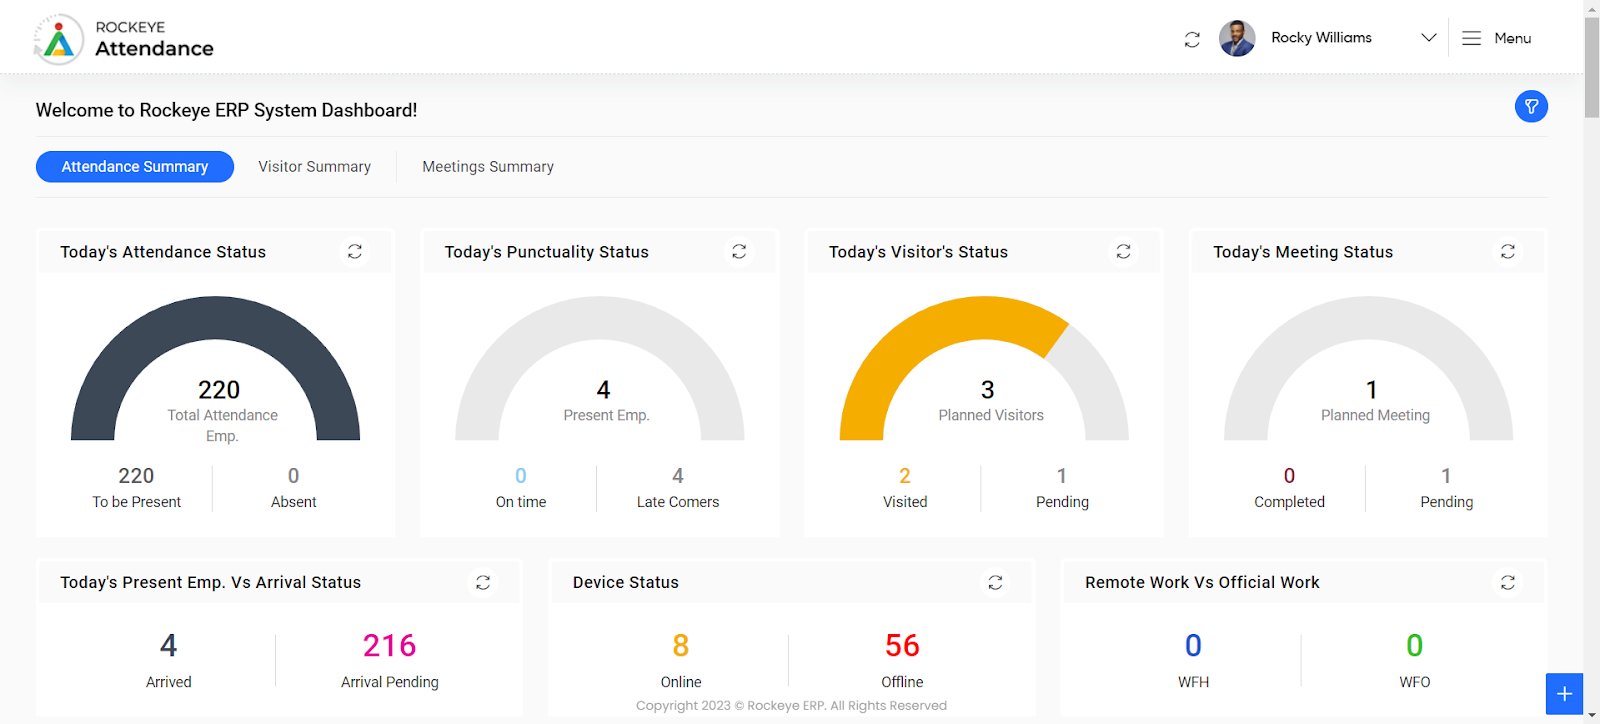
In the Attendance Summary section , the user will be able to view the overall summary of the Attendance & Visitor Management platform of an organization. It is a concise overview of essential attendance metrics and key performance indicators (KPIs) that provide an at-a-glance understanding of the current state of the workforce and HR operations. Its primary purpose is to offer a quick snapshot of critical HR information, as shown below.

Top Summary Section
- This section provides quick-glance statistics for the current day, including
- Total Employee Count: Total number of employees in the system.
- Present/Absent/On Leave Status: A donut chart showing a breakdown of who is present, absent, or on leave.
- Punctuality: Displays whether any punctuality records are available for the day.
- Planned Visitors: Number of scheduled visitors and their visit status.
- Meeting Summary: Shows if any meetings are scheduled or completed today.
Today’s Statistics
- Breakdown of live attendance, including arrival status, remote/in-office work ratio, lunch/break status, and device connectivity.
- Present Employee Arrival Status: Shows how many employees have arrived vs. pending arrival.
- Remote vs. Official Work: Tracks employees working remotely vs. those in-office.
- Lunch vs. Break: Displays the number of employees on lunch or break.
- Device Status: Monitors how many biometric or tracking devices are online or offline.
Weekly Attdendence Summary
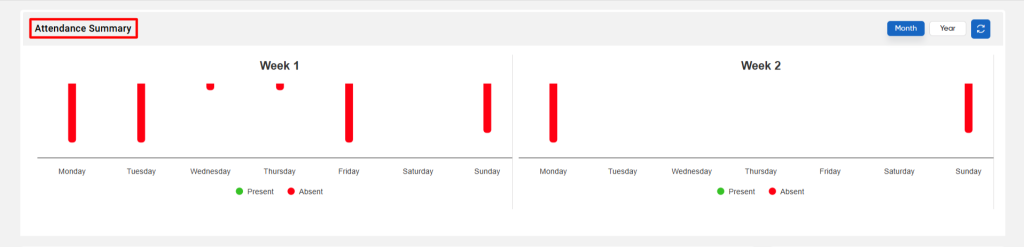
- Three panels show visual bar charts:
- Each week (Week 1, 2, and 3) displays employees’ attendance status (present, absent, or on leave) per day, allowing comparison over time.
Top 10 Punctual Employees – YTD
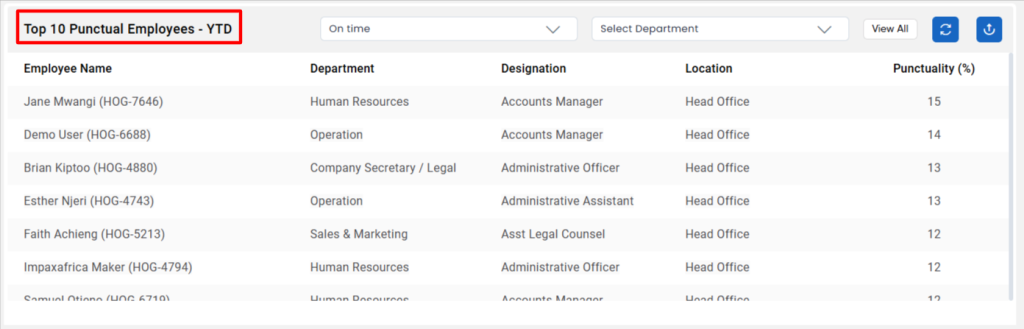
- Shows a leaderboard of the most punctual employees for the year-to-date (YTD). If no data is found, an icon is displayed accordingly.
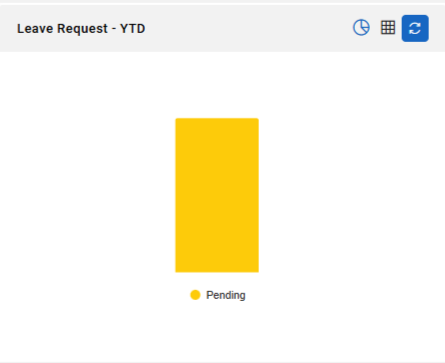
Leave Request – YTD

- A bar chart representing leave requests categorized by status: approved, declined, or pending across the year.
Top 10 Regular Absentees – YTD
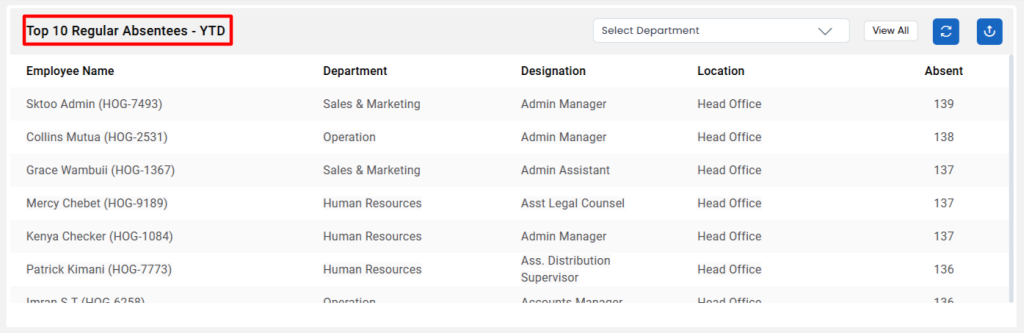
- A table listing employees with the highest number of absences year-to-date, along with department, designation, and office location.
Official Work Request – YTD
- Displays official work requests submitted by employees throughout the year. If none, it shows a placeholder.
Current Status
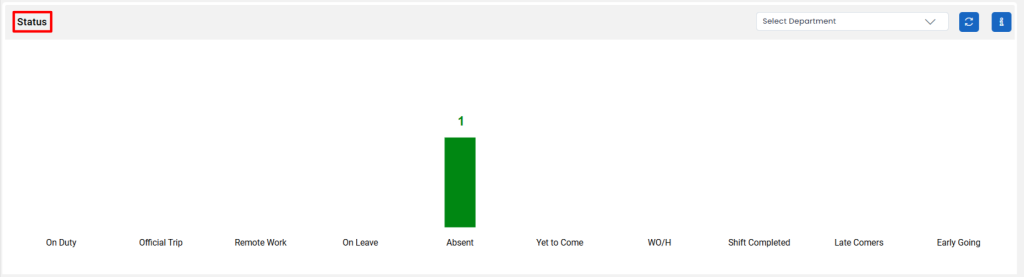
- A bar chart showing a live count of employees based on their current status such as:
- On duty
- Official trip
- Remote work
- On leave
- Absent
- Shift Completed
- Yet to come
- Late comers
- Early Going
Average Department Attendance – YTD
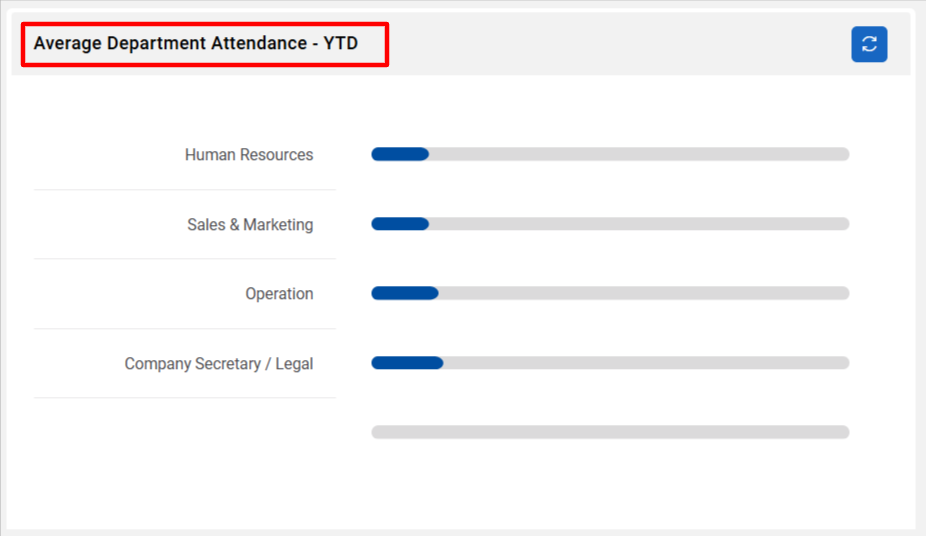
- A progress bar showing average attendance per department for the year to date
Recent Activity
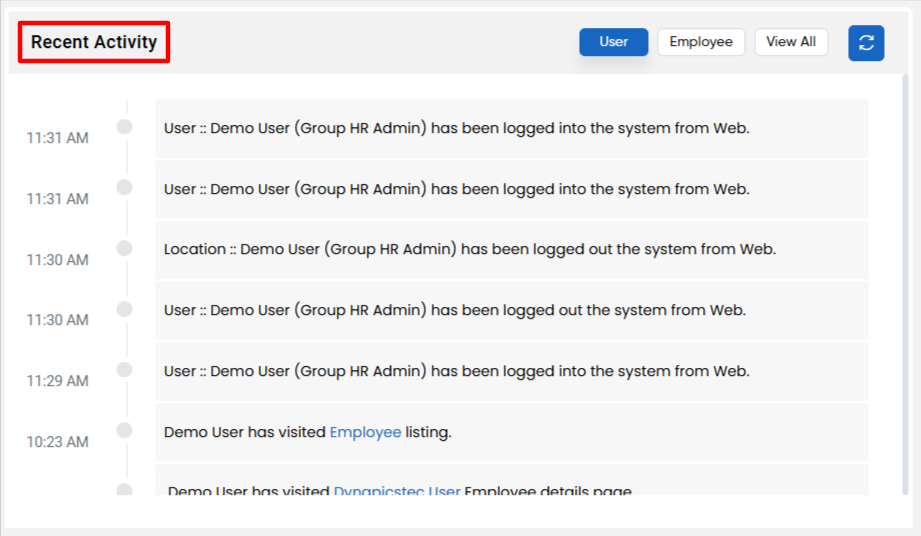
- A timeline of system activities including visitor check-ins, user log updates, approvals, and alerts — useful for admin tracking.
Average Attendance – YTD
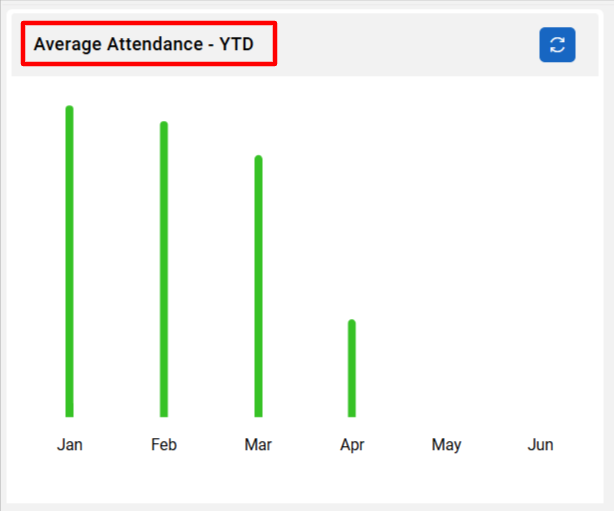
- A bar graph displaying average monthly attendance, helping identify trends over the course of the year.
Average Attendance by Gender – YTD
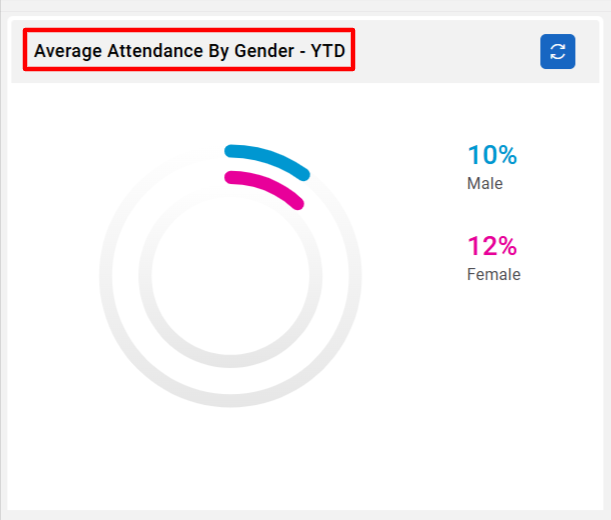
- A donut chart showing the gender-wise breakdown of attendance trends for the year to date
Average Attendance by Age Group – YTD
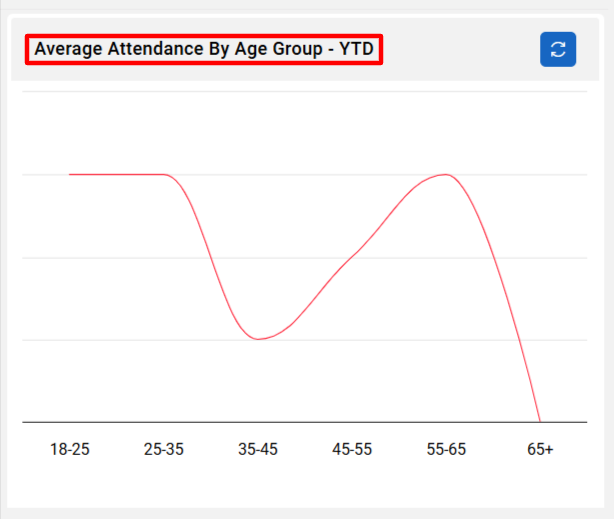
- A line graph visualizing attendance distribution across different employee age brackets.
Top 5 Visiting Purposes
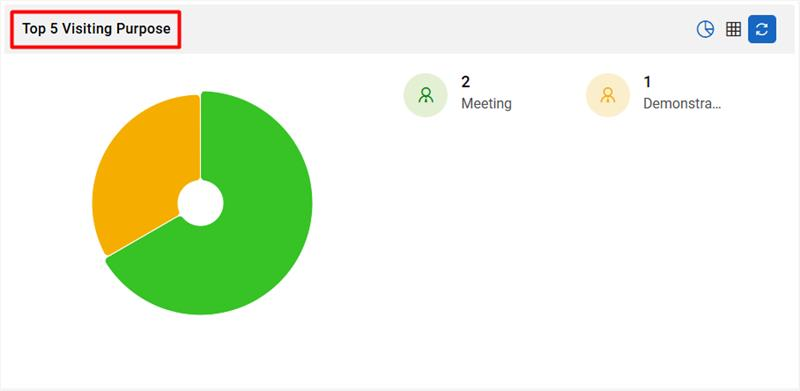
- A donut chart summarizing the main reasons visitors come to the premises (e.g., maintenance, meetings).
Monthly Visitors Count
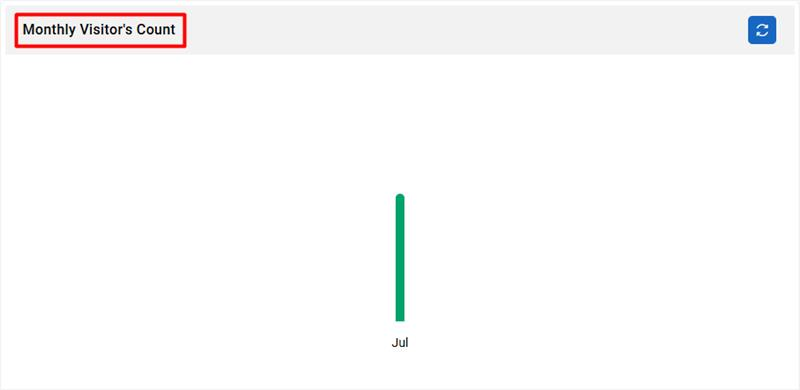
- A vertical bar chart showing how many visitors arrived each month, aiding in tracking footfall.
Average Absenteeism Rate
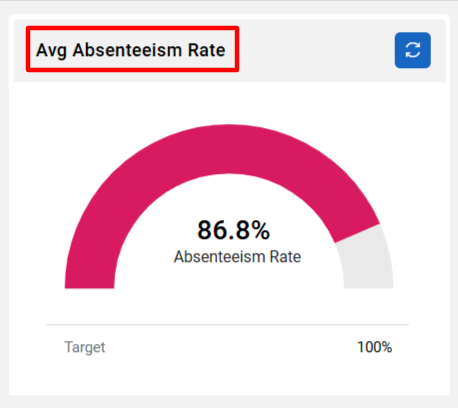
- Displays a circular progress bar showing the absenteeism rate compared to a set target.
Absenteeism Over the Last 5 Years
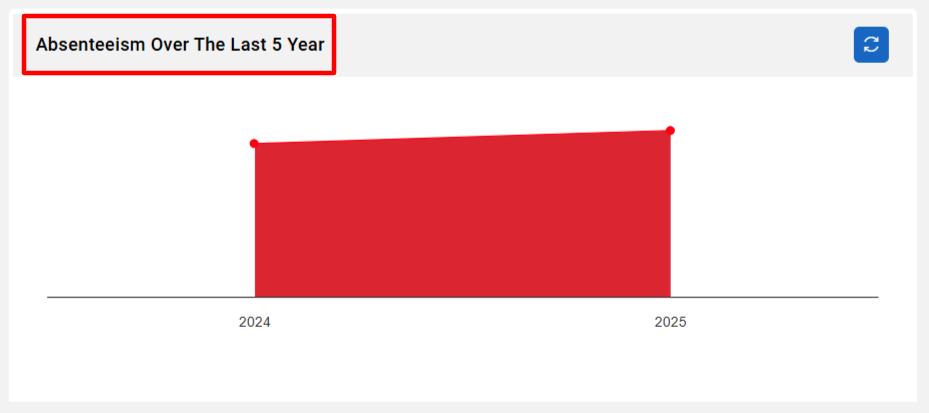
- A minimalistic trend chart showing yearly absenteeism trends, useful for long-term analysis.
Remote Work Request – YTD

- A vertical bar graph showing the number of approved remote work requests for the year.
Employee Leaves
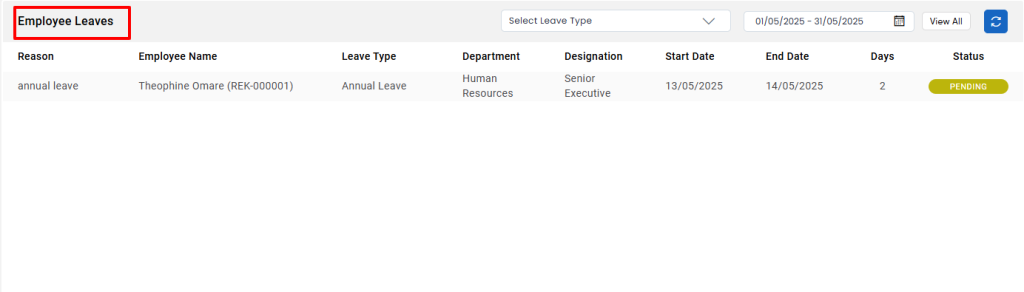
- A detailed table listing leave records including:
- Reason, Employee name, department, designation
- Leave start and end dates
- Number of days
- Current status (e.g., pending, approved)
Public Holiday Calendar
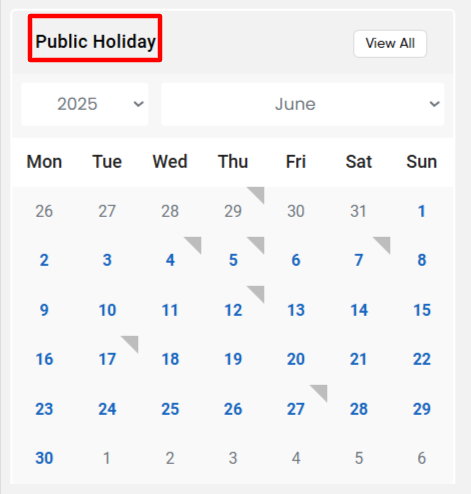
- A monthly calendar view highlighting official holidays for the selected month and year
Visitor Details
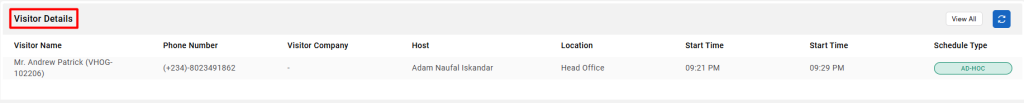
- A summary table displaying the latest visitor information such as:
- Visitor name, phone number, company, host, office location
- Check-in time, visit type (on-premise or remote)
- Schedule status (e.g., scheduled, checked-in)
Visitor Summary :
The Visitor Summary module allows the user to track, review, and manage all visitor-related activities within the organization. It provides insights into visitor check-ins, visit purposes, host interactions, and visit durations.
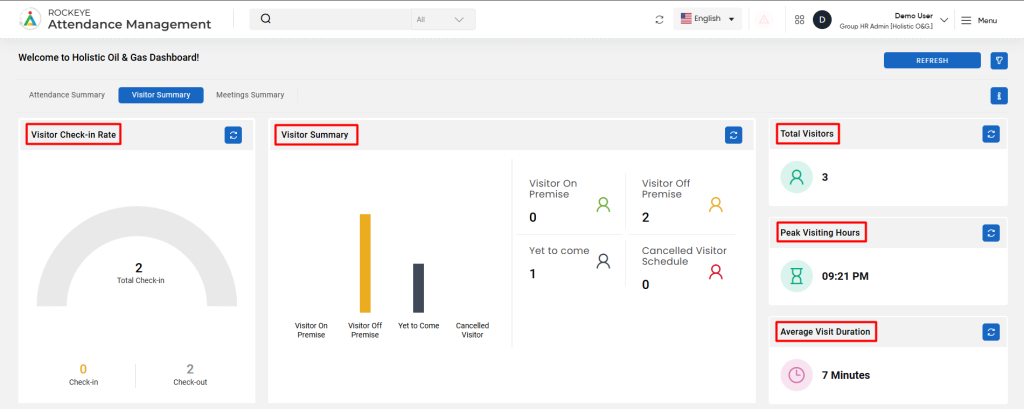
- Top Overview Section
- Total Check-in: A semi-circle gauge indicating the total number of visitor check-ins for the current day.
- Check-in / Check-out Count: Displays the count of visitors currently on-site and those who have already checked out.
- Visitor Status Summary:
- Visitor On Premise: Number of visitors currently present at the office.
- Visitor Off Premise: Visitors who have completed their visit and exited the premises.
- Yet to Come: Visitors who are scheduled but haven’t arrived yet.
- Cancelled Visitor Schedule: Visits that were scheduled but cancelled.
- Right Info Panel
- Current Visitor Count: Number of visitors currently being tracked.
- Peak Visiting Hours: The time of day with the highest number of visitor check-ins.
- Average Visit Duration: Displays the average time spent by a visitor, which may be unavailable if insufficient data exists.
Visitor Attendance Statistics
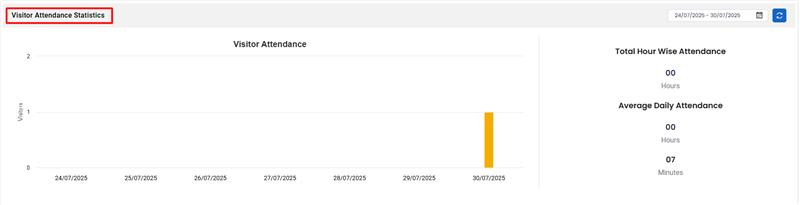
- Visitor Attendance Bar Chart: A timeline view showing the number of visitors over a selected date range.
- Total Hour-wise Attendance: Total hours recorded by all visitors during the selected date range.
- Average Daily Attendance: Aggregated average time spent by all visitors per day.
Meeting Summary
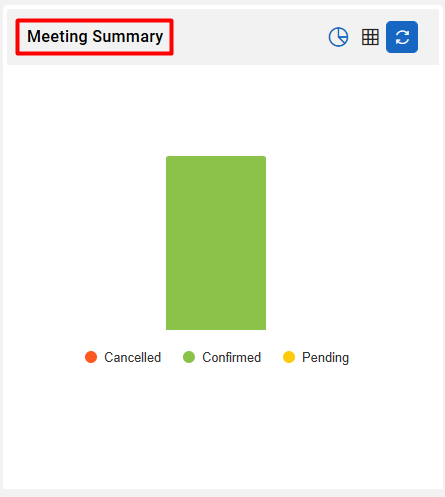
- If no meeting records exist, an empty state is shown with a placeholder icon
Visitor Category Wise Statistics
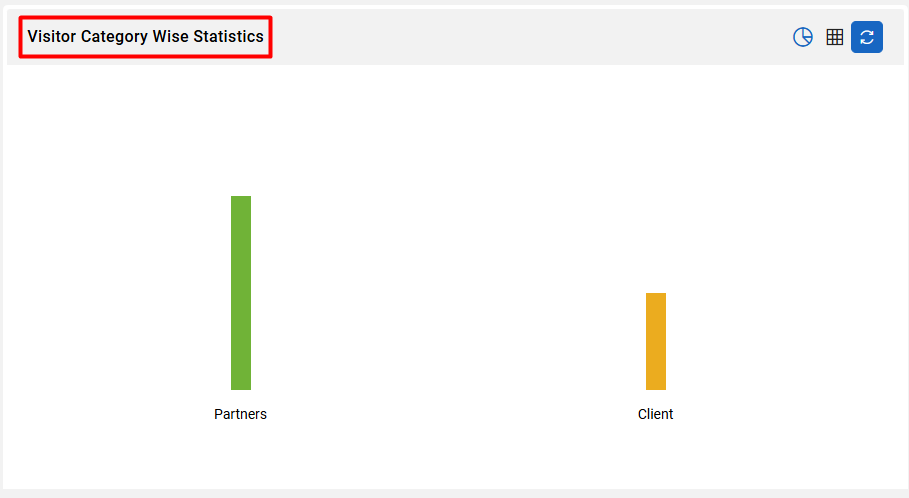
- Displays a vertical bar graph showing visitor count based on visitor categories such as “Client”, “Vendor”, “Maintenance”, etc.
Visitor Statistics
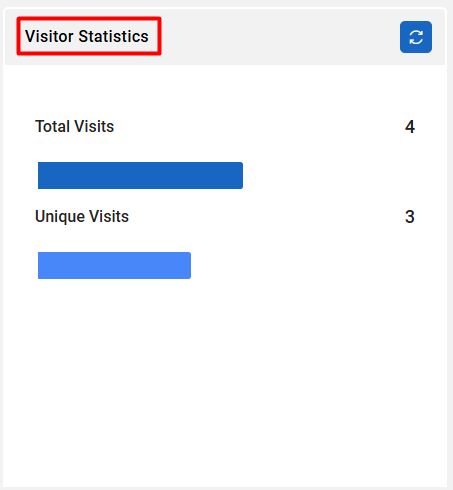
- Total Visits: Total number of visits logged in the system.
- Unique Visits: Number of individual visitors (no repetition).
Meeting Room Summary
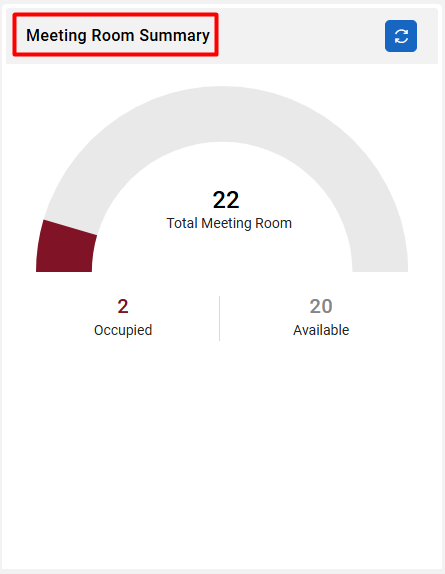
- Semi-circle gauge showing:
- Total Meeting Rooms Available
- Count of rooms currently Occupied and Available
Visitor Purpose Wise Statistics
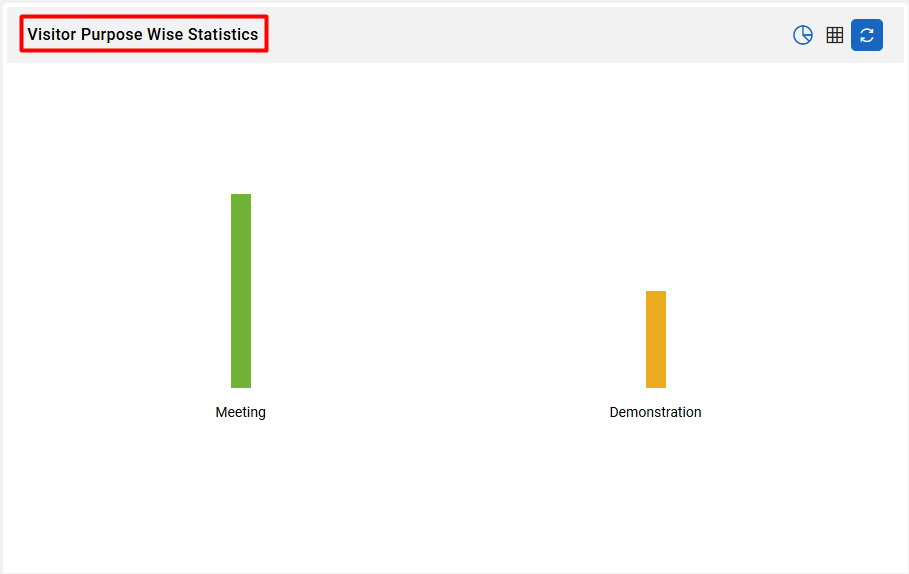
- A vertical bar chart categorizing visits based on their purpose (e.g., maintenance work, client meeting, delivery, etc.)
Frequent Visitor List
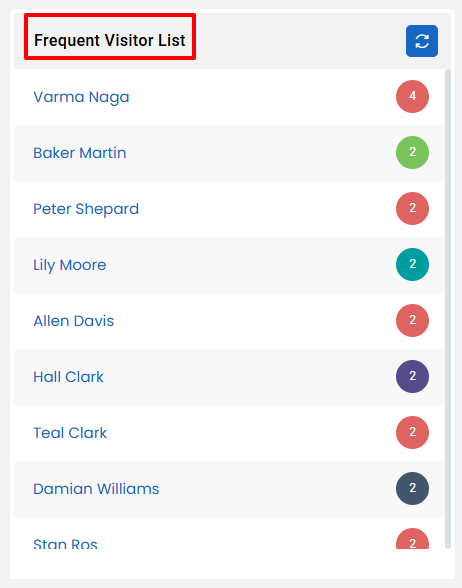
- Displays a vertical list of recurring visitors, usually sorted by visit frequency.
- Each entry shows the name and includes an icon or status indicator.
Peak Visiting Hours Statistics
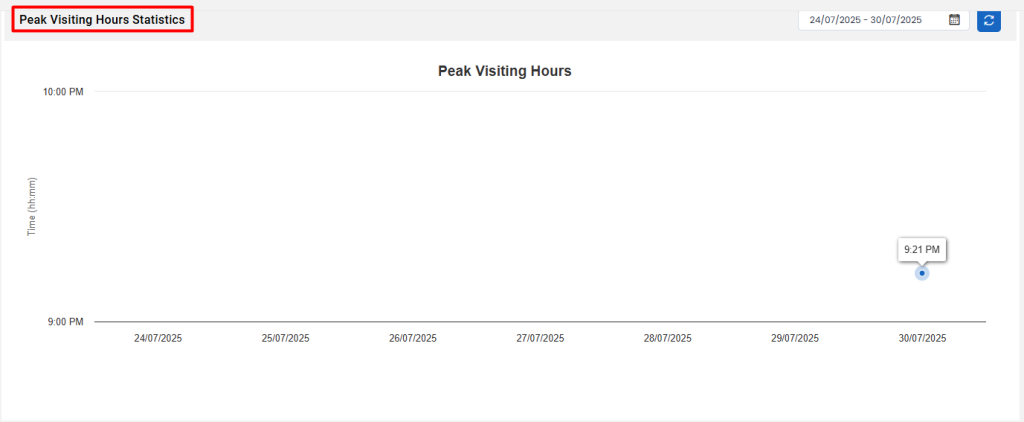
- A bar chart indicating the hours during which most visitors arrived.
- Helps identify when visitor footfall is at its highest across the selected date range.
Frequent Host List
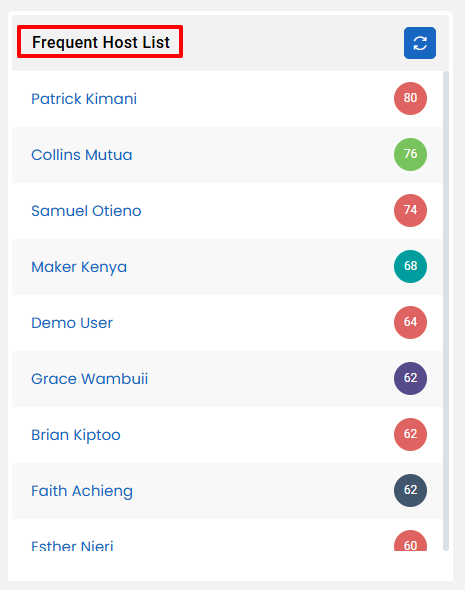
- Lists employees or staff who frequently receive visitors.
- Helps identify commonly visited departments or people
Visitor Details Table

- A detailed tabular view with the following fields:
- Visitor Name: Name of the visitor.
- Phone Number: Contact details.
- Visitor Company: Organization or company the visitor represents.
- Host: The employee or person the visitor came to meet.
- Location: The office or building location.
- Check-in / Check-out Time: Timestamp of the visit.
- Schedule Type: Whether the visit was scheduled or walk-in.
Meeting Summary :
The Meeting Summary module enables the user to monitor and manage meeting room bookings, usage, and statuses across locations. It offers a consolidated view of room availability, booking trends, and meeting request statuses, allowing the user to optimize room utilization, avoid scheduling conflicts, and ensure smooth coordination of internal and external meetings.
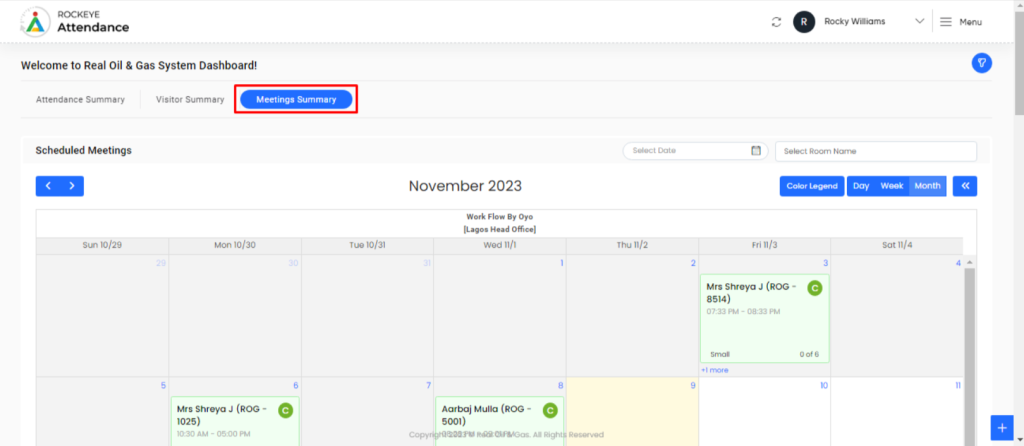
- Calendar View (Top Section)
- User can view meeting bookings on a monthly calendar layout.
- Each entry displays the visitor or booking name, meeting room, scheduled time, and status indicators.
- User can toggle between Day, Week, and Month views.
- Navigation arrows allow the user to scroll through previous or upcoming months.
- A Color Legend helps the user interpret the status of each booking.
Meeting Room Status
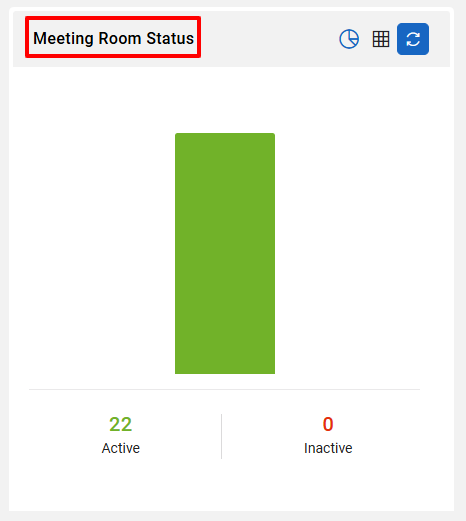
- User can view a visual breakdown of Active vs. Inactive meeting rooms.
- This helps the user identify which rooms are available or under maintenance.
Meeting Booking Status
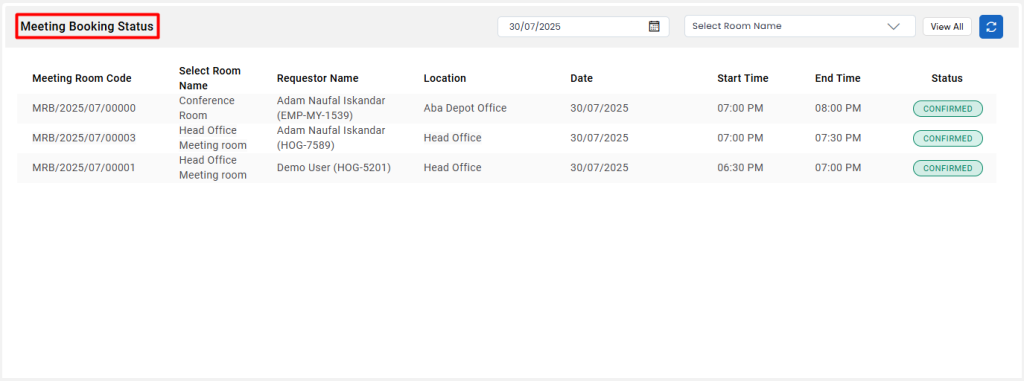
- User can check the list of meeting bookings for a specific date and room.
- A message is shown if no bookings are found.
- User can use filters like Date Picker and Room Name to refine the view.
Occupancy Summary
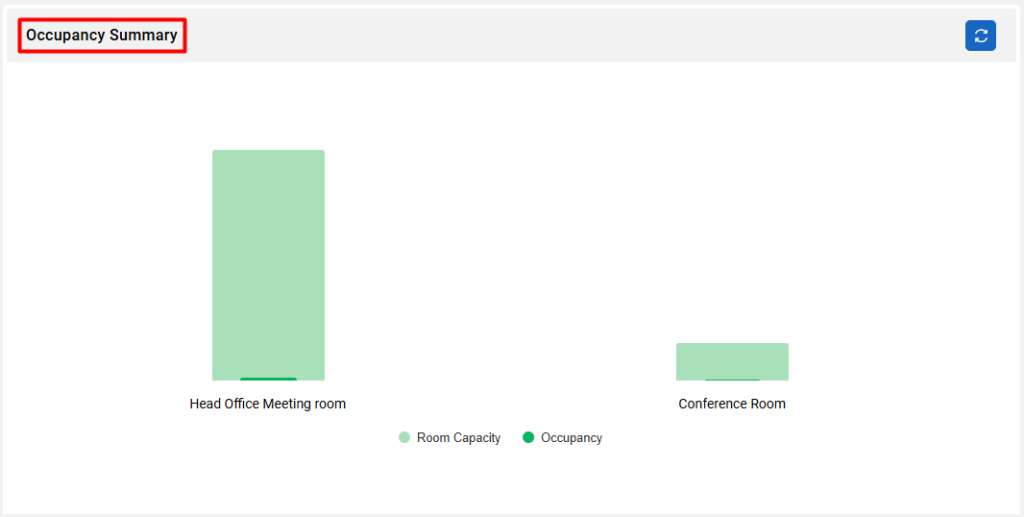
- User can see if any meeting rooms are currently occupied.
- If no rooms are occupied, a message will be shown.
- This helps the user manage live room usage effectively
Monthly Meeting Request Status
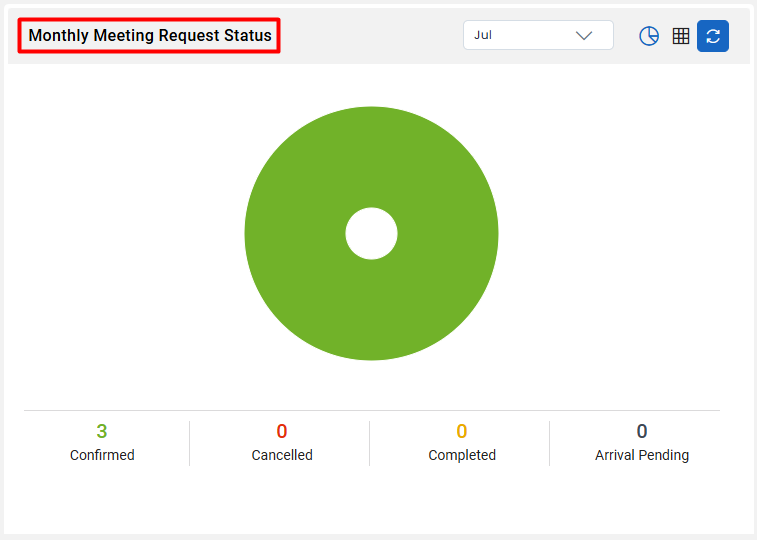
- User can analyze the status of meeting requests made in the selected month.
- Categories include: Confirmed, Cancelled, Completed, and Arrival Pending.
- This helps the user track request flows and follow up as needed.
Location-wise Meeting Room Count
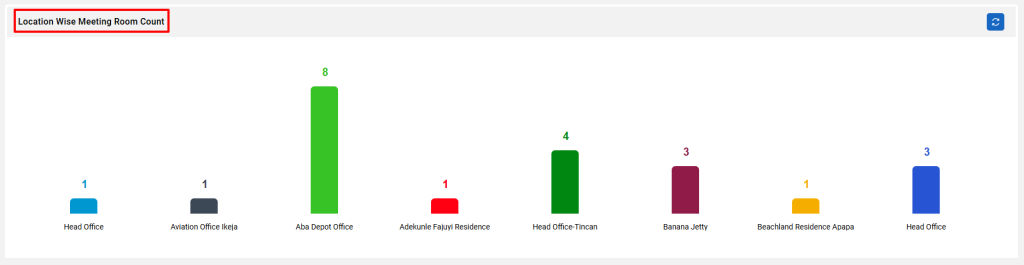
- User can view a bar chart showing the number of meeting rooms by location.
- This helps the user understand how resources are distributed geographically
Most Occupied Meeting Rooms
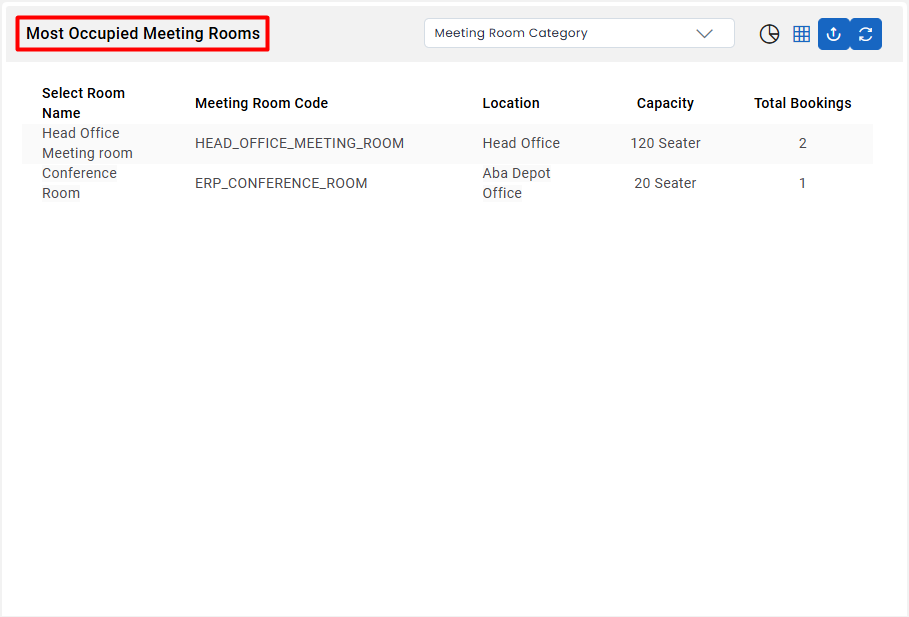
- User can identify rooms with the highest number of bookings.
- If there are no frequently used rooms, a message will be displayed.
- Filter options allow the user to analyze based on Room Category.
Most Available Meeting Rooms
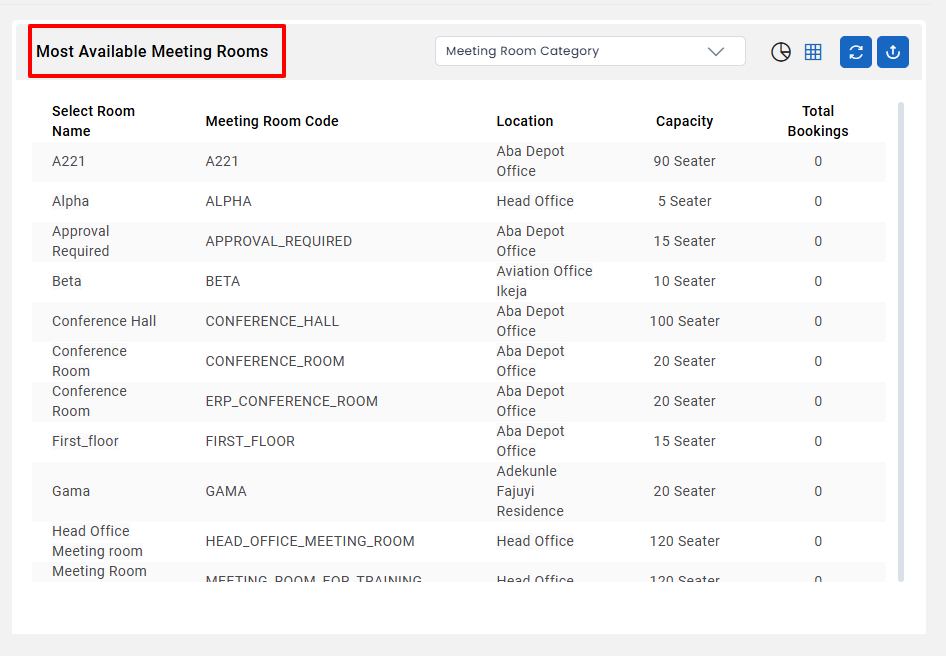
- User can view a list of rooms with minimal or no bookings.
- Table shows: Room Name, Code, Location, Capacity, and Total Bookings.
- This helps the user identify underused rooms and optimize scheduling.